Central Bank of the Russian Federation – Precious metals rates
Official discount prices for precious metals are established by the Central Bank of the Russian Federation every working day. Prices are calculated based on the fixing of gold, silver, platinum and palladium on the London spot metal market, and are converted into rubles at the official US dollar/Russian ruble exchange rate effective on the day following the day the discount prices are set. Accounting prices are used for accounting purposes in credit institutions.
| date | Gold rub./gram | Silver rub./gram | Platinum rub./gram | Palladium rub./gram |
| 20.11.2021 | 4354.45 | 58.41 | 2456.31 | 4959.40 |
| 19.11.2021 | 4342.80 | 58.45 | 2488.27 | 5020.89 |
| 18.11.2021 | 4351.20 | 59.16 | 2498.17 | 5043.17 |
| 17.11.2021 | 4367.41 | 58.81 | 2579.97 | 5080.63 |
| 16.11.2021 | 4330.74 | 57.99 | 2502.53 | 4851.70 |
| 13.11.2021 | 4271.28 | 57.67 | 2470.42 | 4686.87 |
| 12.11.2021 | 4255.85 | 55.34 | 2481.29 | 4692.48 |
| 11.11.2021 | 4147.92 | 55.40 | 2397.90 | 4563.97 |
| 10.11.2021 | 4181.37 | 55.65 | 2427.14 | 4806.15 |
| 09.11.2021 | 4173.18 | 54.68 | 2380.41 | 4659.83 |
| 04.11.2021 | 4095.36 | 54.85 | 2401.81 | 4622.04 |
| 03.11.2021 | 4117.01 | 54.84 | 2431.37 | 4688.08 |
| 02.11.2021 | 4083.12 | 54.87 | 2363.18 | 4520.67 |
| 30.10.2021 | 4072.70 | 54.44 | 2303.55 | 4532.27 |
| 29.10.2021 | 4077.04 | 54.59 | 2303.57 | 4489.24 |
| 28.10.2021 | 4003.77 | 53.77 | 2280.37 | 4455.24 |
| 27.10.2021 | 4029.35 | 54.37 | 2347.97 | 4548.36 |
| 26.10.2021 | 4056.97 | 54.96 | 2354.09 | 4581.91 |
| 23.10.2021 | 4083.35 | 55.38 | 2421.81 | 4590.72 |
| 22.10.2021 | 4074.76 | 55.30 | 2398.79 | 4719.99 |
| 21.10.2021 | 4062.16 | 54.72 | 2385.00 | 4788.28 |
| 20.10.2021 | 4059.97 | 54.14 | 2407.14 | 4748.12 |
| 19.10.2021 | 4032.86 | 53.13 | 2400.33 | 4661.09 |
| 16.10.2021 | 4080.10 | 53.23 | 2420.87 | 4901.29 |
| 15.10.2021 | 4147.69 | 53.87 | 2384.09 | 5031.28 |
| 14.10.2021 | 4083.30 | 52.87 | 2344.93 | 4807.69 |
| 13.10.2021 | 4065.28 | 52.32 | 2343.35 | 4897.00 |
| 12.10.2021 | 4036.46 | 51.87 | 2381.50 | 5007.14 |
| 09.10.2021 | 4067.69 | 52.19 | 2295.96 | 4619.69 |
| 08.10.2021 | 4086.92 | 52.73 | 2291.49 | 4420.30 |
| 07.10.2021 | 4078.88 | 52.02 | 2209.46 | 4418.93 |
| 06.10.2021 | 4101.65 | 52.46 | 2239.81 | 4474.95 |
| 05.10.2021 | 4107.31 | 52.31 | 2239.05 | 4454.66 |
| 02.10.2021 | 4115.97 | 51.80 | 2260.08 | 4435.75 |
| 01.10.2021 | 4043.86 | 50.29 | 2238.09 | 4413.09 |
| 30.09.2021 | 4074.26 | 52.23 | 2262.11 | 4444.69 |
| 29.09.2021 | 4055.46 | 51.75 | 2277.58 | 4536.50 |
| 28.09.2021 | 4086.21 | 52.69 | 2303.41 | 4618.50 |
| 25.09.2021 | 4119.80 | 53.19 | 2307.36 | 4689.83 |
| 24.09.2021 | 4140.97 | 53.17 | 2361.53 | 4832.95 |
| 23.09.2021 | 4159.94 | 53.27 | 2272.87 | 4562.14 |
| 22.09.2021 | 4157.60 | 53.09 | 2177.12 | 4486.05 |
| 21.09.2021 | 4142.76 | 52.80 | 2187.91 | 4689.39 |
| 18.09.2021 | 4120.07 | 53.68 | 2213.89 | 4770.70 |
| 17.09.2021 | 4148.59 | 54.66 | 2193.70 | 4732.06 |
| 16.09.2021 | 4219.32 | 55.83 | 2190.00 | 4609.54 |
| 15.09.2021 | 4181.70 | 55.17 | 2235.04 | 4811.41 |
| 14.09.2021 | 4200.92 | 55.41 | 2241.62 | 5023.67 |
| 11.09.2021 | 4210.48 | 56.20 | 2308.88 | 5183.86 |
| 10.09.2021 | 4221.14 | 56.77 | 2311.18 | 5301.84 |
| 09.09.2021 | 4245.35 | 57.41 | 2363.58 | 5565.39 |
| 08.09.2021 | 4260.95 | 57.05 | 2386.08 | 5638.12 |
| 07.09.2021 | 4277.87 | 57.95 | 2413.54 | 5690.23 |
| 04.09.2021 | 4244.41 | 56.34 | 2354.04 | 5659.06 |
| 03.09.2021 | 4251.36 | 56.60 | 2342.15 | 5724.22 |
| 02.09.2021 | 4268.38 | 56.29 | 2386.09 | 5833.46 |
| 01.09.2021 | 4274.39 | 56.65 | 2379.50 | 5852.16 |
| 31.08.2021 | 4254.30 | 55.85 | 2344.18 | 5726.80 |
| 28.08.2021 | 4271.00 | 56.16 | 2354.94 | 5756.51 |
| 27.08.2021 | 4243.41 | 56.32 | 2359.83 | 5725.91 |
| 26.08.2021 | 4255.03 | 56.32 | 2370.88 | 5770.73 |
| 25.08.2021 | 4286.39 | 56.49 | 2413.09 | 5796.18 |
| 24.08.2021 | 4255.14 | 55.79 | 2421.78 | 5524.60 |
| 21.08.2021 | 4262.78 | 55.48 | 2338.26 | 5525.27 |
| 20.08.2021 | 4263.04 | 55.64 | 2314.85 | 5669.12 |
| 19.08.2021 | 4223.31 | 55.91 | 2376.07 | 5930.73 |
| 18.08.2021 | 4238.06 | 56.46 | 2418.98 | 6108.87 |
| 17.08.2021 | 4190.07 | 55.55 | 2387.92 | 6165.65 |
| 14.08.2021 | 4151.89 | 55.24 | 2409.42 | 6155.84 |
| 13.08.2021 | 4152.17 | 55.38 | 2400.71 | 6225.30 |
| 12.08.2021 | 4123.87 | 55.68 | 2385.31 | 6271.24 |
| 11.08.2021 | 4092.41 | 55.34 | 2340.14 | 6154.41 |
| 10.08.2021 | 4115.74 | 56.34 | 2306.61 | 6191.92 |
| 07.08.2021 | 4230.86 | 58.72 | 2355.90 | 6240.07 |
| 06.08.2021 | 4260.67 | 59.87 | 2394.75 | 6259.75 |
| 05.08.2021 | 4241.34 | 60.07 | 2445.42 | 6203.64 |
| 04.08.2021 | 4239.95 | 59.65 | 2469.42 | 6274.29 |
| 03.08.2021 | 4243.23 | 59.64 | 2471.92 | 6253.75 |
| 31.07.2021 | 4299.07 | 59.94 | 2485.50 | 6226.68 |
| 30.07.2021 | 4281.39 | 59.89 | 2534.31 | 6226.37 |
| 29.07.2021 | 4258.18 | 58.68 | 2501.47 | 6174.40 |
| 28.07.2021 | 4266.86 | 59.63 | 2500.07 | 6227.63 |
| 27.07.2021 | 4307.56 | 60.43 | 2525.24 | 6367.90 |
| 24.07.2021 | 4276.19 | 59.68 | 2577.97 | 6415.29 |
| 23.07.2021 | 4258.64 | 59.40 | 2558.88 | 6314.27 |
| 22.07.2021 | 4325.24 | 60.13 | 2574.69 | 6378.04 |
| 21.07.2021 | 4347.53 | 60.10 | 2581.74 | 6226.84 |
| 20.07.2021 | 4310.29 | 60.53 | 2595.85 | 6264.94 |
| 17.07.2021 | 4344.52 | 62.25 | 2708.77 | 6466.70 |
| 16.07.2021 | 4371.55 | 62.53 | 2729.83 | 6700.50 |
| 15.07.2021 | 4320.73 | 62.37 | 2654.80 | 6729.95 |
| 14.07.2021 | 4304.58 | 62.16 | 2662.01 | 6757.41 |
| 13.07.2021 | 4326.22 | 62.21 | 2627.48 | 6718.67 |
| 10.07.2021 | 4317.67 | 62.27 | 2588.11 | 6739.63 |
| 09.07.2021 | 4376.42 | 63.11 | 2603.73 | 6844.17 |
| 08.07.2021 | 4295.95 | 62.82 | 2602.45 | 6745.42 |
| 07.07.2021 | 4258.37 | 62.68 | 2614.67 | 6687.42 |
| 06.07.2021 | 4223.75 | 62.60 | 2598.94 | 6591.68 |
| 03.07.2021 | 4221.29 | 61.94 | 2589.34 | 6577.49 |
| 02.07.2021 | 4158.37 | 61.56 | 2540.97 | 6471.96 |
| 01.07.2021 | 4109.93 | 60.24 | 2464.37 | 6249.77 |
| 30.06.2021 | 4117.54 | 60.39 | 2505.99 | 6207.96 |
| 29.06.2021 | 4117.26 | 60.54 | 2566.55 | 6123.97 |
| 26.06.2021 | 4137.67 | 60.63 | 2552.33 | 6134.87 |
| 25.06.2021 | 4139.56 | 60.44 | 2513.69 | 6078.42 |
| 24.06.2021 | 4165.39 | 60.62 | 2537.22 | 6072.04 |
| 23.06.2021 | 4185.05 | 61.09 | 2493.48 | 6064.34 |
| 22.06.2021 | 4194.80 | 61.08 | 2447.53 | 5902.30 |
| 19.06.2021 | 4161.79 | 61.27 | 2507.73 | 5939.62 |
| 18.06.2021 | 4211.68 | 62.00 | 2596.83 | 6445.44 |
| 17.06.2021 | 4303.16 | 64.17 | 2665.59 | 6394.17 |
| 16.06.2021 | 4304.46 | 63.80 | 2674.34 | 6355.59 |
| 12.06.2021 | 4360.10 | 64.85 | 2664.06 | 6381.31 |
| 11.06.2021 | 4368.50 | 64.20 | 2648.49 | 6413.47 |
| 10.06.2021 | 4381.15 | 63.92 | 2681.37 | 6477.46 |
| 09.06.2021 | 4430.04 | 64.89 | 2734.75 | 6588.69 |
| 08.06.2021 | 4412.90 | 64.67 | 2731.61 | 6663.73 |
| 05.06.2021 | 4404.19 | 64.47 | 2716.18 | 6673.84 |
| 04.06.2021 | 4456.92 | 65.38 | 2795.95 | 6703.69 |
| 03.06.2021 | 4480.03 | 65.56 | 2804.89 | 6718.04 |
| 02.06.2021 | 4492.16 | 66.43 | 2795.09 | 6748.73 |
| 01.06.2021 | 4477.30 | 65.11 | 2757.15 | 6638.36 |
| 29.05.2021 | 4477.30 | 65.37 | 2796.46 | 6690.70 |
| 28.05.2021 | 4475.59 | 65.31 | 2810.46 | 6534.90 |
| 27.05.2021 | 4498.40 | 66.43 | 2839.40 | 6571.73 |
| 26.05.2021 | 4442.93 | 65.02 | 2789.22 | 6449.18 |
| 25.05.2021 | 4436.75 | 65.35 | 2751.62 | 6614.29 |
| 22.05.2021 | 4441.88 | 65.77 | 2822.23 | 6699.55 |
Major crashes in gold prices since the 1970s
The recovery of the American economy in 1976 led to a significant drop in gold prices - by 22.4%. However, the 1980 crisis contributed to a new rise in gold prices, the average annual cost of which was about $615 per ounce. The price of the precious metal reached its maximum in the 20th century on January 21, 1980 - $850 per ounce, after which its long decline began.
By May 1982, the price had fallen to $300 an ounce after the US monetary authorities adopted a “dear money” program aimed at reducing the rate of money supply growth. Thus, quotes for the precious metal fell by 2.6 times.
At the end of the 1980s, the cost of an ounce of gold on stock exchanges was already about $500.
In March 1993, the next major collapse of the gold market occurred - the price of the precious metal dropped to $326 per troy ounce.
After reaching a record price level for the 90s in early February 1996 - $417.70 per ounce - in July 1997 the price of gold fell to its lowest level in several years - $331.45 per ounce.
At the end of 1997, the largest drop in precious metal prices in 15 years occurred. The collapse began on November 26 - prices on the London Stock Exchange dropped below the psychological mark of $300 per ounce. The fall was triggered, in particular, by the statement of the Governor of the Bank of England, Eddie George, that the new European currency, the euro, would be backed by less gold than planned, so European central banks would continue to sell gold. The financial crisis in Southeast Asia, whose countries have traditionally been the largest buyers of gold, also played a role. Subsequently, 1997 was called the “black year” in the gold market.
By early 1998, gold prices had fallen by $90, reaching $278.7 per troy ounce (less than $9 per gram), the lowest level in 20 years.
July 1999 was marked by a sharp collapse in world gold prices. The troy ounce of the precious metal fell in price by more than 3% in the first week of the month and dropped to $260. By that time, the gold market crisis had been going on for several years. Initially, this trend was explained by the global financial crisis and a decrease in demand for precious metals from Asian consumers, but later it became clear that, in fact, a new approach to the role of gold in the foreign exchange reserves of national banks was being formed in the world.
In 2001, the average annual price of gold fell to $271.1 per ounce. Then a long period of growth began, lasting about 12 years, but from time to time the price of the precious metal, for one reason or another, decreased.
Gold prices collapsed on October 10, 2008, when investors around the world sold the metal, fearing the spread of the global financial crisis. Expectations of a global economic downturn led to a sharp drop in commodity prices, including gold, the price of which fell by 7.2% in one day.
On February 20, 2009, at auction in New York, the cost of an ounce of gold exceeded one thousand dollars for the first time in 11 months. At this point, since January 1, 2009, gold has risen in price by 13%. From January to December 2009, the price of gold increased by 27% against the backdrop of a depreciation of the dollar against a basket of six currencies of countries that are the main trading partners of the United States. The average annual cost of a troy ounce was about $1,120.
In January 2011, gold fell 6.2%, its worst monthly decline since December 2009. However, already in early February 2011, gold rose in price again on speculation that rising food and oil prices would increase the attractiveness of precious metals as a hedge against inflation. Eurozone inflation accelerated to 2.4% year on year in January 2011 from 2.2% in December 2010.
At the end of August 2011, the fall in gold prices exceeded 5.5%. During trading in New York, December gold futures fell to $1,757.3 per troy ounce. Investors' desire to take profits in the gold market was supported by the growth of world stock exchanges and increased interest in higher-yielding and risky assets against the backdrop of positive statistics from the United States. However, on August 22, gold rose above a record high of $1,910 an ounce amid global economic uncertainty. Since the beginning of July, metal prices have increased by about 25%.
On April 12, 2013, the price of gold fell to its lowest level since August 2011 amid a general drop in quotations on the commodity market after the release of weak statistical data in the United States, as well as in anticipation of the sale of the precious metal by the Central Bank of Cyprus. By the end of trading, June gold futures on the New York Comex exchange fell in price by $63.5, or 4.1%, amounting to $1,501.4 per troy ounce and very close to the psychological mark of $1,500. Over the past week, prices for the precious metal decreased by 4.7%.
On April 15, 2013, the price of gold on world exchanges fell by 9.3% against the backdrop of China’s quarterly GDP statistics, which turned out to be worse than expected. By the end of trading, June gold futures on the New York Comex exchange fell to $140.30, or 9.3%, breaking through another psychological barrier of $1,400 and amounting to $1,361.10 per troy ounce. Thus, the price of the metal dropped to a two-year low, and the one-day drop in quotations was the most significant since the 1980s.
Ladies' whims
In the view of a financial advisor, gold is a permanent and strategic component of any investment portfolio for those over 40. There are times when this asset shows good results, and there are years when, on the contrary, the investor begins to doubt the need for such investments. For many, elementary greed takes over, fear fades into the background, and the precious metal leaves the family portfolio. As a rule, this happens just when a little more should be added.
For example, in July 2015, gold prices reached their five-year low. It was a good time to start (continue) shopping. Especially for those who had a long-term vision of the development of their personal capital and looked at their investments from this position. Not immediately, but after a long fall, gold gradually turned around and began its confident path upward.
True, an inquisitive reader can say that everything is not so simple with gold: in August 2011, its price came close to $1900, and many people who then bought this precious metal in the rush found themselves at a big loss, because this price the level has not been reached so far. Indeed, this is a serious argument, and it requires a clear and logical explanation.
The rally in the gold market from its local peak in October 2008 to the record at the end of August 2011, when prices rose by almost 86%, is due to many factors, but no one will argue that the main reason was the 2008 crisis and related problems in the financial sector, including a strong “crack” of the world’s leading banks. It is clear that in such a situation everyone turned to the time-tested protection of their capital - gold. As for buying at maximum values, unfortunately, this is, as a rule, the fate of every typical investor who buys any asset at its peak, and I don’t see anything surprising in this event.
Another issue is that since 2011, we have not reached the gold prices we saw almost 10 years ago. There are many different positions among analysts on this issue. I am on the side of those who connect the massive exodus of investors into gold after the 2008 crisis with its scale and the shock to the financial foundations of modern society that both the relevant institutions and private investors experienced. Perhaps someday I will measure the depth of the crisis by the duration and scale of gold growth in the “post-shock” phase.
It is believed that gold is a good protection in case of any significant political or economic shocks. However, little attention is paid to the fact that gold is also a very capricious “lady”, whose behavior is very difficult to accurately predict, and in practice various surprises may await you.
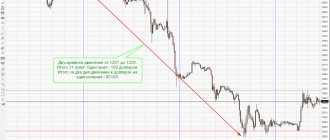
Gold price chart for the last 10 years
Rice. 1. Gold price chart for the last 10 years (source)
As a rule, gold does not rise in price continuously throughout the crisis. It behaves differently at its individual stages, reflecting the level of fear for the future.
In many situations, you can observe a sharp rise in gold prices at the very beginning, when the crisis is just beginning to develop. This, for example, happened during the 2008 crisis, when in the first two and a half months the price of gold “jumped” by almost 20%. However, then there was a sharp drop, then a rise again, a fall again, and so on. As a result, the price for the entire year increased only by 6%. And this was in conditions when the world stock market was in a very feverish state. However, in the future, apparently, as understanding of the depth of the crisis grew, the demand for gold and, accordingly, its prices grew for several more years.