I am glad to welcome readers of our resource again, and we are talking about gold again. The purpose of writing this article is to consider how the gold rate has changed over 10 years. Let's talk about what factors and to what extent influence its value and how to conduct a preliminary analysis of changes in its course for the future.
The role of this metal can hardly be overestimated: it is a unique reserve currency, which is also a commodity. An increase in its production does not lead to inflation and depreciation, as happens with any other monetary unit.
Gold cannot turn into a useless piece of metal - in almost all cultures, jewelry made from it is a favorite among women and men, and its physical properties make this substance indispensable in the production of electronics, high-precision optical instruments, medicine and many other industries.
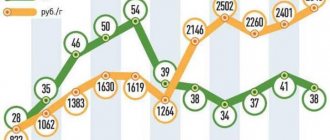
Dynamics of gold prices over the past 10 years in Russia in rubles
An excellent visual example is the graph of exchange fluctuations in gold prices over the past ten years:
To create the most complete picture possible, take a look at the data on how the average price of gold changed, presented in the table:
| Year | End of year price | % change |
| 2018 | 2670.58 | +11.22 |
| 2017 | 2400.97 | +6.21 |
| 2016 | 2260.43 | -9.65 |
| 2015 | 2502.1 | +16.58 |
| 2014 | 2146.08 | +69.74 |
| 2013 | 1264.3 | -21.88 |
| 2012 | 1618.56 | -0.7 |
| 2011 | 1629.81 | +17.84 |
| 2010 | 1383.06 | +30.19 |
| 2009 | 1062.32 | +29.26 |
| 2008 | 821.8 |
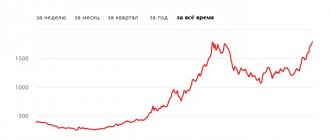
Price chart in dollars per ounce:
Gold rate in Sberbank
Gold quotes at Sberbank reflect increased demand from private investors and are used by other banks as a benchmark. If we analyze the growth chart of gold in recent years, we can conclude that prices for it have increased significantly - more than six times. Sberbank publishes quotes for gold and other metals daily, they can be tracked online, and you can also use the archive for past years.
According to Russian legislation, on the domestic market of precious metals, operations for their sale are processed at negotiated prices. That is, each commercial bank has the right to use its own pricing policy.
Sberbank, when forming quotes for precious metals, like other banks, is based on the accounting price of the Central Bank of the Russian Federation and the fixing of the London Stock Exchange. What else does the gold price depend on? At Sberbank, the rate of precious metals depends on the following factors:
- Fluctuations in demand;
- The cost of bank services for the purchase and sale of gold;
- Regional differences;
- Bank benefit;
- Other factors.
The rate may depend on seasonal fluctuations: on pre-holiday days there is usually a slight increase. The cost of providing the service itself to clients and the size of the bank’s profit included in the price of gold directly affects the metal’s quotes.
The higher the values of these factors, the higher the rate. For Sberbank, the regional factor is of great importance.
Gold quotes provided by bank branches in other regions may differ significantly from the prices presented in Moscow.
The difference can be up to 10%.
A similar situation arises when analyzing the value of the bank spread. The difference between the purchase and sale prices that Sberbank lays down may differ by branch. Gold price statistics are recorded by the bank daily; you can view the archive of quotes since May 2002 using the functionality of the institution’s official website.
Price changes over the last ten years.
Dependence on the type of investment
The gold rate at Sberbank also depends on the form in which the client wants to purchase the precious metal. The choice can be made by choosing one of three forms:
- Gold bars;
- Coins;
- Anonymized metal account.
It is gold bars that are characterized by the highest price: their rate is the highest among all forms of investment in the metal offered by the bank. The purchase of gold coins will cost approximately the same amount. The high cost is due to the peculiarities of taxation. The purchase of gold bars or coins is subject to a value added tax of 18 percent. This amount is also included in the final price for the buyer.
VAT makes bullion far from the most profitable investment.
When choosing an impersonal metal account as an investment vehicle, the client wins for two reasons:
- The gold rate according to compulsory medical insurance does not include VAT, in this case there is no need to pay tax;
- The client gets rid of the issues of organizing the storage of his purchase.
It is for these reasons that compulsory medical insurance is now considered the most popular option for “gold” investments.
Quotes as an indicator of the state of the economy
What else do quotes show? The precious metal exchange rate has always been an indicator of the economic development of both a specific country and the world economy as a whole. Changes in the gold rate in the analysis should be understood as a leading factor.
The price chart for gold and other precious metals at Sberbank can provide information about an imminent change in stock prices. What's the connection here? If the economy is in working order, then stocks that bring large dividends are considered a priority investment object. As soon as there is a downturn in the economy, investors transfer their assets from securities to gold in order not to lose their funds. Demand for the precious metal is growing, and its prices are also rising. Given their stable, increasing trend over a period of time, we can confidently talk about the upcoming fall in financial indices.
The gold rate at Sberbank is accepted as a benchmark for all purchase and sale transactions in the precious metals segment of the financial market.
Investing in gold is explained by the increasing dynamics of its prices in recent years: since 2000, over ten years, quotes have increased from 258 rubles per gram to 1,622 rubles, and at the beginning of 2015 they were already more than 2.5 thousand rubles.
In the long term, the reliability and profitability of investments in this metal is obvious, especially considering the fact that significant stock market crashes have occurred several times over the years.
Factors that influence the rise or fall of the exchange rate
I highlight one single factor: the ratio of supply to demand. Everything else is the consequences of changing this ratio. Let's take a closer look at how this works.
Expert opinion
Lyudmila Pestereva
Our most experienced gold investor
Ask a Question
The 2008 crisis was the result of gross financial fraud with securities of American bankers. The natural economic reaction to this would have been a collapse in the value of the dollar, which is what happened initially. But by integrating the dollar into the economies of other countries, the United States imported its inflation into other currencies, and the value of the dollar did not fall too much.
However, this did not add confidence to him, and since 2008 there has been a persistent trend: states are increasing the share of 999 precious metal in their gold and foreign exchange reserves. Demand increases and so does the price.
Political aspect: refusal of some states to use the dollar as a reserve currency in settlements. Each country is equally interested in strengthening its currency, and it is not easy to agree on who will pay with what. Why not use metal? As a result, the demand for it will increase, and hence its exchange rate.
There is no permanent growth for anything on the stock exchange. This is due to the colossal influence of major players on the market - they are the ones who make the difference. In order to bring down the quotes of a particular commodity, be it stocks or precious metals, a player, sometimes in tandem with other interested parties, can drain a certain amount of an asset, provoking its fall due to a glut of supply in the market, in order to then buy it cheaper and make money.
This fact is indirectly confirmed by the fact that on the stock exchange transactions in which the object is physical metal occupy barely a tenth, the rest is securities, essentially not backed by precious metals. Dummies, but they really change the value of gold.
Another indicator of the stability of gold is its finiteness as a resource. Deposits are being depleted, reserves are drying up and, according to expert forecasts, gold mining volumes will steadily decline in the coming decades.
The invention of a cheap method of extracting the precious metal can have a huge impact on the price of gold. So, in 1947, after successful experiments on the transmutation of mercury isotopes into gold, the price of gold collapsed - holders hurried to get rid of the asset, which, in their opinion, was about to depreciate. But parity was just as quickly restored after it was announced that this method of production did not pay off at all.
Gold/silver ratio: 27 years of data
Author: G. I. Christenson
From a statistical point of view, the prices of gold and silver change approximately simultaneously. But more important is the ratio of gold and silver prices and its trends.
Let's look at this graph.
Gold/silver ratio: 27 years of data – silver is cheap (in green), silver is too expensive – (in red)
1. Over the past 27 years (since the 1980 bubble and subsequent correction), there has been a downward trend in the gold-silver ratio.
2. Silver's peak near $50 in April 2011 (the low of the ratio) looks like a clear anomaly.
3. Silver price lows in 2003, 2008, and 2013 were at or above the trend lines I depicted in this chart. The price of silver has risen strongly since reaching ratio peaks in 2003 and 2008. I expect similar dynamics after recent attitude spikes.
4. The magnitude of the ratio may fall over several months or decline slowly over several years.
My takeaways from this chart are that the gold to silver price ratio is at the high end of the range, long-term silver prices are gradually rising relative to gold, and a run-up in prices for both metals is possible at any time or in the coming years.
What else can you learn from the graph?
Let's take weekly silver prices (solid line) and weekly gold/silver ratio (dashed line) and smooth them with a 7-week simple moving average. This cuts off some of the “noise” from the graph. Let's plot these weekly data back to 2002, roughly the start of the gold and silver bull market. Let's look at the graph.
1. It can be seen that the price of silver usually moves in the opposite direction of the ratio. This simply says that the price of silver goes up and down faster than the price of gold, but they usually move together.
2. The ratio has risen over the past 3 years to levels seen in 2008 and 2003, prior to periods of significant silver price increases.
3. Now the gold/silver ratio is high - over 66.
Statistics
- From January 2002 to May 2014 (more than 12 years), the correlation coefficient between the curve with the weekly leveling of silver prices and the same leveling of the gold/silver ratio was equal to 0.65 with a minus sign.
- From May 2008 to May 2014 (6 years from the start of the crisis), the correlation coefficient between the weekly smoothed silver price and the weekly smoothed price ratio was 0.90 with a minus sign - a fairly strong negative correlation.
- The average weekly data on the smoothed gold/silver ratio over the past 12 years is 59.9, with a standard deviation of 9.24.
- Based on data from the last 12 years, the ratio is above average, with a standard deviation of 0.77.
- Similarly, based on data for 6 years after the crisis, the ratio is above average, with a standard deviation of 0.86.
Based on the ratio data and statistics, we can conclude that:
1. The gold/silver ratio is now high and is in the zone of the 27-year trend line, when it is quite possible to expect silver prices to rise and the ratio to begin to decline.
2. Silver prices rise and fall with gold prices, but silver prices rise faster than gold prices.
3. The gold/silver ratio is noticeably higher than the average for the last 6 and 12 years (standard deviation 0.8), and is likely to decline. Therefore, the price of silver is likely to rise in a few months.
Fundamentals
There is great demand for gold - from China, Russia and India. Westerners have some (or most) of their gold. German gold held at the New York Federal Reserve has not been returned, possibly because it is no longer in the vaults. If most of the central bank gold is gone ("losed" to the market), soon demand will outstrip the supply of real, physical gold. High-frequency traders can crush the paper market, but not forever.
There is reason to believe that gold, with a price about 40% below its 2011 peak, and with demand rising and supply shrinking, will rise strongly in price over the next few years. The price of silver will follow the price of gold, but will rise stronger and faster given today's low price and oversold conditions. Was the above analysis conclusive evidence that gold and silver prices should begin to rise? Obviously not!
But he points to the facts:
- The correction in silver prices lasted more than three years. Growth can begin at any moment.
- Gold prices are now high relative to low silver prices - the ratio is at the top of a 27-year trend and is likely to decline.
- Silver prices have fallen faster (since April 2011) and will rise faster than gold prices. When the price of silver eventually takes off, it will bring the ratio down a lot, likely to around 30.
- Many other signs (not shown here) also suggest that silver is very low, oversold and ready for a rally. The same is true for gold.
Investor demand for silver and gold bars and coins is high and growing. I think silver and gold prices will rise by the end of 2014, and will be significantly higher by the next US presidential election.
The pieces of paper that we mistakenly call money will lose value in the coming years. Take this chance and turn paper money into physical silver while high frequency traders and central bankers give you artificially low prices for silver and gold.