A.V. Volkov
— Chief Researcher, Head of the Laboratory of Geology of Ore Deposits, IGEM RAS, Doctor of Geology and Mineralogy.
Gold mining is a global business with operations on every continent except Antarctica. For many countries around the world, well-managed, transparent and accountable gold mining is a key driver of economic growth, creating jobs for the population and developing regional infrastructure and economies. In addition to employing local people, gold mining also brings foreign direct investment, foreign exchange and tax revenues to countries.
Gold mining companies operating in remote locations are investing in infrastructure and utilities. Noticeable improvements in transport accessibility, communications, water supply and electricity supply for local communities accompanies the entire period of gold mining development.
Expert estimates indicate that approximately 190,040 tons of gold have been mined throughout history, of which about 70% has been mined since 1950. And since gold is virtually indestructible, almost all of this metal is still around in one form or another. If each ton of this gold were placed next to each other, the result would be a cube of about 21 m on each side. A map of gold production by country shows the geographic dispersion of gold production and supply (Fig. 1).
Rice. 1.
Gold mining by country in 2021
Today, the level of global gold production is relatively stable. At the same time, it has shown a slight upward trend in recent years. Each year, global mining adds approximately 2,500–3,000 tonnes to the total land-based gold supply. The stability of gold production results from the fact that the construction of new mines mainly only replaces exhausted capacities, rather than expanding them. The mining process takes a very long time, and it often takes up to ten years to open a new mine. This means that the commissioning of such mines is not able to quickly respond to price changes. For example, South Africa was once a leading gold-producing country, producing more than 1,000 tonnes in 1970, but the country's annual production has fallen steadily since then. On the other hand, over the past few years, a number of countries have begun to increase gold production. In China, Russia, and Canada there is a general trend of production growth.
Even a prolonged rise in price, as has happened with gold over the past 11 years, does not lead to a sharp increase in global production of the metal. This raises the question: has the world reached peak gold production? Since all the easy gold has already been discovered, we have to dig deeper and deeper. Nowadays, to find new gold deposits, gold mining companies have to explore new, inaccessible territories: deserts, jungles and polar regions.
While primary gold production is relatively inelastic, gold recycling ensures that the metal can be easily supplied to consumers when needed. Thus, secondary production, on the one hand, helps to compensate for the increase in demand, on the other hand, to maintain a consistently high price for the metal. The high cost of gold in turn makes recycling economically viable.
| Countries | Production, t | Reserves, t | |
| 2017 | 2018 | ||
| USA | 237 | 210 | 3000 |
| Australia | 301 | 310 | 9800 |
| Brazil | 80 | 81 | 2400 |
| Canada | 164 | 185 | 2000 |
| China | 426 | 400 | 2000 |
| Ghana | 128 | 130 | 1000 |
| Indonesia | 75 | 85 | 1400 |
| Kazakhstan | 85 | 85 | 1300 |
| Mexico | 126 | 125 | 1400 |
| Papua New Guinea | 64 | 65 | 1300 |
| Peru | 151 | 145 | 2600 |
| Russia | 270 | 295 | 5300 |
| South Africa | 137 | 120 | 6000 |
| Uzbekistan | 104 | 105 | 1400 |
| Other countries | 883 | 920 | 12000 |
| Total | 3230 | 3260 | 54000 |
Table 1.
Gold production by country in 2017–2018, t/year (Source: US Geological Survey)
Gold mining in 2021
Gold production in 2021 increased for the tenth time in a row and amounted to 3,260 tons (Fig. 2). New mines in Canada and Russia and increased production at the Grasberg mine (Indonesia) more than compensated for the decline in gold production in China and the United States (due to stricter environmental regulations). However, the leaders of the TOP 10 remained in their places (Table 1). As can be seen in Figure 3 (p. 9), China ranks first among global gold producers by a wide margin, producing 91 tons more than second place Australia (Table 1). Note that of the leading producers, Russia received the largest annual increase, increasing production by 25 tons. The share of countries with a relatively small volume of gold production (Argentina, Bolivia, Chile, Colombia, Mali, Morocco, Papua, the Philippines, Tanzania, etc.) increased noticeably and amounted to just over 30% of total world production in 2021. In 1969 this share was less than 10%. Below, according to the Mineral Commodity Summary 2019, is the ranking of the leading gold producing countries in 2021.
Rice. 2.
Global gold production, t/year
Major investors and largest gold holders
National governments
The largest holders of gold in the world are national governments. The largest gold reserve, more than 8,000 tons, is managed by the US government. This is more than Germany, Italy and France combined, which have 2,000-3,000 tons each. Russia closes the top five with 2,300 tons.
Stanley Druckenmiller, hedge fund manager, CEO of Duquesne Family Office
Former chairman and president of hedge fund Duquesne Capital, Stanley Druckenmiller now manages his family's fortune. In 2016, he advised investors to exit the stock market and invest in gold. At the end of 2021, he warned against shorting the stock market, but still recommended gold as an inflation hedge and maintained large holdings.
Jeffrey Gundlach, CEO at DoubleLine Capital
Gundlach is a well-known gold bull who expects the value of the US dollar to decline as the country's fiscal and trade deficits continue to rise. “The dollar is going to fall significantly,” Gundlach told CNBC on July 15, calling the currency “doomed.” It is worth noting that Gundlach is also of the opinion that Bitcoin can become a hedge against the fall of the dollar.
I am a long term dollar bear and gold bull but have been neutral on both for over six months. Lots of liquid poured into a funnel creates a torrent. Bitcoin maybe The Stimulus Asset. Doesn't look like gold is.
— Jeffrey Gundlach (@TruthGundlach) February 18, 2021
John Paulson, hedge fund investor Paulson & Company
The billionaire hedge fund manager predicted the collapse of the real estate bubble in 2007 and made millions of dollars shorting subprime mortgages. Paulson's investments include gold stocks, ETFs and bullion. The SPDR Gold Trust ETF accounts for about 6.96% of Paulson & Company's $4.35 billion portfolio, while raw materials and basic materials account for 18.62%, according to GuruFocus.
Ray Dalio, founder of Bridgewater Associates
Billionaire investor Ray Dalio is a long-term gold bull and founder of the world's largest hedge fund, Bridgewater Associates. At the end of 2021, Bridgewater held about $532 million in the SPDR Gold ETF and gold mining stocks, according to a filing with the U.S. Securities and Exchange Commission.
Speaking at the Qatar Economic Forum, Dalio said it was difficult for the US Federal Reserve to avoid overheating inflation and tightening monetary policy would have a "big negative effect" on financial markets.
China (401 tons)
Despite the fact that gold production in China fell by 5.87% last year to 401.12 tons, the country has maintained its status as the world's largest producer for 12 years in a row (about 12% of total world production). The drop in production is due to increased government efforts to combat environmental pollution. However, production is expected to resume at previous levels this year after several mines are upgraded.
Rice. 3.
Gold production by country in 2021, t/year (Source: US Geological Survey)
Should you sell gold?
Even though gold is a popular investment vehicle, there are disadvantages to trading this precious metal.
- Gold does not pay interest or dividends
The value of gold falls when currencies, interest rates or stocks rise. Since the precious metal itself does not generate interest or dividends, investors abandon gold in favor of other growth assets (listed above) in order to receive high income that will offset the initial investment.
- Gold may be below the market for a long time
Some investors do not consider gold as a long-term investment, buying it only to hedge uncertainty and volatile risks, and then selling it to move on to other financial investments. Over the past 10 years, the Dow Jones Industrial Average (DJIA) has returned 189% and gold has returned 12%. However, gold has outperformed the DJIA over the past 20 years, delivering a return of 573% compared to 234%.
- Storing physical gold is not cheap
The advantage of physical gold is that it is not a management fund or a mining company - the precious metal cannot go bankrupt. However, for larger investments, for example, if you decide to invest in gold bars, coins, jewelry, etc., then you will have to incur warehouse costs for storing and insuring the physical gold.
- Gold is expensive
Since the price of gold has not retreated much from its all-time high, it is a fairly expensive asset for investors with a small portfolio. Some retail investors prefer to invest in silver because its maximum, less than $50 per ounce, is incomparably lower than gold's $2,000 per ounce.
You decide whether to buy or sell gold. The decision should be based on reliable information obtained from the analysis, taking into account your risk appetite, the diversification of your portfolio and the hedging instruments you use. Never invest more than you can afford to lose.
Australia (310 tons)
Although gold production increased by 9 tons compared to the previous year, according to MinEx Consulting, production in the country is expected to fall in the near term unless exploration funding doubles. Note that the mining industry produces more than half of Australia's total exports and generates about 8% of GDP. The main producers and deposits of Australia at the end of the year: Cadia Valley, Newcrest Mining - 751,965 thousand ounces. (545.869 thousand ounces in 2017); Boddington deposit, Newmont Mining - 709 thousand ounces. (787 thousand ounces in 2021); Super Pit, joint venture (JV, 50x50) of Barrick Gold and Newmont - 628 thousand ounces. (738 thousand ounces in 2017); Tanami, Newmont - 496 thousand ounces. (419 thousand ounces in 2021); Tropicana, a joint venture (JV, 50x50) of AngloGold and Independence Group - 477.908 thousand ounces. (461.7 thousand ounces in 2021). In the fourth quarter of 2021 alone, production amounted to 81 tons, the third quarter in a row above 80 tons, and 1 ton higher than the same period in 2017.
FAQ
The direction of the gold price depends on monetary policy in the US and other major economies. While some analysts expect gold prices to rise in the second half of 2021 due to rising inflation, others believe there is a possibility of a fall in prices for the precious metal due to rising real interest rates and the economic recovery from the COVID-19 pandemic.
Gold is often seen as a useful hedging tool for a diversified portfolio. However, some investors avoid holding gold because it does not pay interest or dividends, unlike stocks and bonds. Whether gold is a good investment depends on your financial situation and risk tolerance.
There are a number of ways and tools for investing in gold. You can buy physical gold, such as jewelry, coins and bars, or invest in financial assets, such as an exchange-traded fund or gold mining stocks. You can also trade gold using contracts for difference (CFDs), speculating on the movement of the gold price.
Russia (295 tons)
Russia is the third largest gold producer after China and Australia. the majority (83%) of European gold comes from Russia, which has been increasing production every year since 2010. Last year, the country increased production by 25 tons. The main deposits producing gold are: Olimpiadinskoye, Natalkinskoye, Pavlik, Kupol, Dvoinoye, Bystrinskoye. In various years, about 80–84% of gold production is provided by 8 constituent entities of the Russian Federation from 26 gold-mining regions. The share of these 8 regions in gold production is gradually increasing. In recent years, the Russian government has been purchasing almost all of the gold mined in the country.
South Africa (120 tons)
Once the world's largest gold producer, leading by a wide margin, the country's gold production has slowed every year since 2008 except for 2013, when production increased by several tons. Over the past 40 years, gold production in South Africa has fallen by 80%. An interesting fact is that China's gold production is only 1/3 of South Africa's peak in the late 1960s. South Africa is still home to the world's deepest gold mine, Mponeng, which reaches a depth of 2.5 miles.
Golden bears
Warren Buffett, Chairman of the Board of Directors of Berkshire Hathaway
As you know, one of the richest people in the world, the “Oracle of Omaha” Warren Buffett has a negative attitude towards gold as a non-productive asset.
In a 2011 letter to shareholders, Buffett pointed out that gold "has two disadvantages: it doesn't have many uses, and it can't be 'multiplied': no matter how long you hold an ounce of gold, even after an eternity, it's still the same ounce of gold."
However, in Q2 2021, Berkshire Hathway invested $564 million in Barrick Gold (ABX), the world's largest gold mining company. This did not escape the attention of investors, but they were even more interested in the sale of 43% of ABX shares a few months later.
World gold reserves
According to the Mineral Commodity Summary 2019, proven global gold reserves are estimated at 54 thousand tons (Table 1, p. 7). The distribution of gold reserves by country (in %), according to TsNIGRI, is shown in Figure 4.
Rice. 4.
Distribution of gold reserves in various countries, % (Source: S&P. Based on data for the fourth quarter of 2021)
According to information and analytical data, 42.1% - i.e. the largest amount of reserves is concentrated in metamorphic deposits of uranium-gold conglomerates (Witwatersrand in South Africa, Tarkwa in Ghana, Jacobina in Brazil). The most significant in terms of reserves - 10.5% in the group of hydrothermal gold ore deposits are epithermal gold-silver and gold-telluride, spatially associated with volcanic belts (Lihir, Porgera in Papua New Guinea, Round Mountain in the USA, Bruserjak in Canada, Fruto del Norte in Ecuador, Kupol, Dvoinoye, Dukat, Mnogoverinnoye, Amethyst, Svetloye in Russia, etc.). The group of deposits located in ancient greenstone belts (Kalgoorlie in Australia, Parkupine and Hemlo in Canada, Kolar in India, etc.), 7.2% of the total world reserves, is the next most important. In third place - 6.3% in terms of gold reserves - is the type of veinlet-disseminated hydrothermal deposits occurring in terrigenous carbonaceous formations (Homestyle (USA), Muruntau (Uzbekistan), Kumtor (Kyrgyzstan), Ashanti (Ghana), Sukhoi Log, Olimpiada, Natalkinskoe, Pavlik, Nezhdanninskoe, Mayskoe (Russia), etc.). The last in the class of hydrothermal deposits is the “Carlin” type of reservoir deposits (4.7% of reserves), which occur in terrigenous-carbonate formations. Gold placers contain about 5% of gold reserves. In terms of gold reserves, 12.6% falls on gold-containing ores in complex deposits of other metals, mainly porphyry copper. The third group, 1.6% in terms of reserves, consists of secondary gold deposits. Among them, the increasing role of gold-bearing weathering crusts is noted.
In recent years, Russia has ranked 2nd–3rd in the world in terms of gold reserves (9%). Over the past three years, the share of gold reserves of the Russian Federation in the global structure of reserves has been slowly declining.
On updating the price forecast for precious metals
03/04/2018
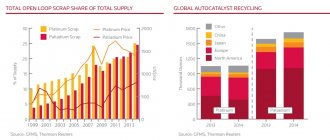
In 2018-2022 global demand for silver and platinum group metals will develop under the influence of technologies aimed at improving the environment: solar energy and car exhaust gas purification systems. Pricing in the gold market will be determined primarily by inflation expectations in the American financial market.
The price of gold in 2021 increased by 1.4% to $1,267/t. ounce and in 2018-2019. it will continue to rise in price in response to the launch of stimulating fiscal policy in the United States, rising inflation and increased demand for instruments to hedge inflation risks. In 2020-2022 Gold prices are expected to decline amid lower inflation in the US and the euro area. With the start of London Metal Exchange (LME) gold futures trading in 2021, gold prices will become more volatile as the start of LME commodity futures trading typically results in a significant increase in price fluctuations.
Platinum in 2014-2017 fell in price by 30% to $953/tre. ounce against the backdrop of a reduction in its consumption and the announcement of the commissioning of large metal mining projects in Zimbabwe and South Africa. Expectations of a further decline in platinum consumption limit the possibility of price recovery in 2018-2019.
Palladium , on the contrary, in 2021 showed a record price increase of 42%, to $886/t. ounce, which was a result of increased demand from automakers in China and India. Fixing prices at a high level will lead to the process of partial replacement of increasingly expensive palladium with platinum in the automotive industry. This allows us to expect an equalization of prices for these metals in 2020-2022. at the level of 1000-1100 dollars/tre. ounce.
silver market is growing at 2-3% and is one of the main beneficiaries of the explosive growth in global solar energy. The expected continuation of the pace of development of renewable energy will lead to an increase in the price of silver by an average of 3% per year in 2018-2022. Long-term silver price forecast in 2021-2022. was reduced by 16%: the risk of silver being replaced by cheaper metals limits the possibility of high rates of price growth.
GOLD MARKET
Dynamics of gold prices, dollars/tr. ounce
Source: exchange data, calculations by Gazprombank Central Electronics Center
Investment demand: rising inflation in the US will stimulate demand for gold in 2018-2019.
A key feature of the gold market is the cyclical nature of investment and jewelry demand in the market. During periods of crisis, investment demand for gold increases, and jewelry demand decreases due to a decrease in real incomes of the population. In 2021, the opposite situation was observed: investment demand decreased with renewed interest in gold jewelry.
Global investment demand for gold (retail investment + ETF transactions) fell 24% to 1,200t in 2021 after rising 52% in 2021. Purchases of gold bars and coins decreased mainly due to the US. The overall decline in investment in gold is due to the tightening of policy by the US Federal Reserve, which raised the key rate three times in 2021.
The decline in investment demand for gold in 2021 is also associated with an increase in “risk appetite” in financial markets. The US S&P 500 share index is up 19% in 2021, the German DAX is up 13% and the FTSE 100 is up 8%. The stock indices of China and India also showed strong growth.
Participants in the European financial market in 2021 provided 73% of investments in physical gold through ETFs: the persistence of negative ECB interest rates stimulated investor interest in gold. In 2021, the ECB reported victory over deflation in the eurozone, which increases the likelihood of monetary tightening in the EU. Expectations of rising interest rates and reductions in asset repurchase programs will lead to lower investment demand for gold in Europe.
Purchases and volumes of accumulated gold in ETF funds, million tr. ounces
Pricing on the global gold market in 2018-2019. will be determined by two processes: stimulating fiscal policy in the United States (increasing government spending against the backdrop of lowering corporate taxes) and tightening monetary policy by the Federal Reserve (raising interest rates). According to the CEP, an increase in US government spending against the backdrop of growing public debt will lead to an acceleration of inflation. This will stimulate interest in gold as a tool for hedging inflation risks, and will allow the metal to rise in price from $1,267 per liter. ounce in 2021 to $1,331/t. ounce in 2021
In 2020-2022 tightening monetary policy will begin to have a positive impact on reducing inflation in the United States, and the ECB will accelerate the pace of rate hikes. This will lead to a decrease in gold prices by 4% to $1,292 per liter. oz.
Dynamics of key factors influencing the price of gold
Jewelry Demand: Gold consumption in the jewelry industry increases as demand recovers in China and India
Total consumption of gold jewelry in the world in 2021 increased by 4-5% to 1.98 thousand tons. Jewelers in India were the main contributor to the increase in gold consumption in the global jewelry industry in 2021.
Agencies that analyze the gold market give varying estimates of gold consumption between countries. This is mainly due to the fact that official data on the domestic gold market in China is not published. Researchers have to make estimates based on consultations with market participants (jewelry manufacturers, retail chains, etc.).
Agency estimates of gold consumption in the jewelry industry, tons
The Indian economy (26% of global jewelry demand) shows high growth rates (6.6-7% per year). The monetary reform that took place in 2021 and the introduction of an excise tax on jewelry made it more difficult to purchase them in the country. This resulted in a 38% decline in jewelry output in 2021 and a corresponding decline in gold consumption. In 2021, the Indian jewelry industry and gold buyers adjusted to new regulations, leading to an estimated 12-32% rise in gold consumption by jewelers, while gold imports rose 67% YoY to the highest since 2015. Consumption gold in India in 2018-2019 will continue to increase against the backdrop of growing well-being of residents of rural areas of the country.
The anti-corruption campaign1 in China (30% of global jewelry demand) led to a decrease in conspicuous consumption2 in the country - government officials reduced the purchase of luxury goods, fearing accusations of possessing wealth acquired illegally. Against this background, purchases of gold by jewelers in 2021 decreased by 17%. In 2017, Chinese jewelry companies noted an increase in demand for gold jewelry, amid a decrease in interest in platinum products. Jewelry demand in China is likely to continue to increase in 2018-2019.
Total demand for gold in the world decreased by 7% in 2021: an increase in jewelry demand by 4-5% (+102 tons) was not enough to compensate for a decrease in investment demand by 24% (-369 tons). The decrease in consumption did not have a negative impact on prices, as it was partially offset by a reduction in metal production by 4% (-163 tons).
Gold supply: production will decline amid low investment in mining
Gold supplies in 2021 decreased by 4% to 4.41 thousand tons, mainly due to a decrease in gold scrap collection by 6% to 1.23 thousand tons. Scrap collection usually decreases when economic conditions improve, i.e. To. stabilization of household incomes reduces incentives to hand over jewelry to pawn shops. Gold production by gold mining enterprises decreased by 0.7% to 3.2 thousand tons.
According to the Bloomberg consensus forecast, investments in the global gold mining industry expected in 2021 will amount to only $10.4 billion, which will be 61% lower than investments in 2012. We predict a decrease in gold production in the coming years, as the industry remains low volume of investment in production.
The launch of gold futures trading on the LME will increase gold price volatility
In 2021, gold futures trading began on the LME. Previously, the main indicator of prices for the precious metal was the “Gold Fixing” - the price that was set during the trading of gold bars on the London interbank market. This resulted in low volatility in gold prices relative to other commodities whose prices were set on futures exchanges.
We expect that the launch of gold futures trading on the LME will increase volatility in gold prices, which could potentially reduce the attractiveness of gold for investors seeking low-risk investments.
In addition, some investors investing in the gold market through ETFs will likely switch to futures market instruments. Reduced interest in ETFs will force funds to sell some gold from warehouses, which could have a negative impact on gold prices.
PLATINUM GROUP METALS
Dynamics of prices for platinum and palladium, dollars/tr. ounce
Platinum in the automotive industry: consumption will decline due to reduced production of diesel passenger cars
Structure of platinum consumption in the world, 2017o
Consumption of platinum3 in the global automotive industry in 2017 decreased by 2.7% to 3.4 million tons. oz. EU diesel vehicle production contributed 48% of platinum consumption in the global automotive industry in 2021 (20% of total global platinum consumption). Declining demand from European automakers led to a reduction in platinum purchases by 8% to 1.56 million tons. ounces (with sales of diesel cars declining by 5% y/y).
We expect that the negative trend will continue in 2018-2019: sales of passenger diesel cars will decline by 3-5% per year amid growing concerns about their environmental safety.
Share of diesel passenger car sales in Western Europe
In September 2021, new diesel exhaust gas control standards came into force in the EU. This will likely lead to accelerated adoption of Selective Catalytic Reduction (SCR) vehicle emissions technology into passenger car production, which will require fewer platinum group metals compared to current Lean NOx trap (LNT) technology. The CRU estimates that specific platinum consumption in EU passenger diesel car production will fall from 3.27 grams in 2021 to 2.82 grams in 2022.
Platinum consumption in the automotive industry
There are discussions in Europe about the advisability of a complete ban on the use of diesel passenger cars. In 2018, cities in Germany received the right to ban the entry of cars with outdated diesel engines after it became known that in 70 cities the content of nitrogen oxides (products of diesel engines) in the air exceeded the maximum permissible standards established by the European Union. Currently, only 18% of vehicles (2.7 million of the 15 million diesel vehicles registered in Germany) comply with the latest Euro 6 standard. Such a ban would likely lead to a further decline in demand for diesel cars across Europe from consumers concerned about possible recalls of such vehicles and a decline in their resale value on the secondary market.
In addition, the ban imposed in Germany, the country that is the largest European car market, is likely to influence changes in environmental policies in other countries and cities of the continent. Thus, the authorities of Paris, Madrid and Athens have already announced plans to ban the entry of diesel passenger cars by 2025, and of Copenhagen - from 2021.
Lower demand for platinum in passenger vehicle manufacturing was partially offset by a 3% increase in purchases from truck manufacturers, primarily from Japan and China.
Palladium in the automotive industry: growth in gasoline car production ensures stable demand
Palladium is mainly used in the production of passenger cars with gasoline engines in exhaust gas treatment systems. China, India and the USA, where gasoline passenger cars are predominantly produced, have tightened requirements for the environmental safety of manufactured vehicles, and in Europe, consumer demand has begun to shift in favor of vehicles with gasoline engines. This spurred demand for palladium from automakers: purchases of the metal increased by 8% in 2021 to 8.4 million tons. ounces, while metal production fell 2%. The palladium deficit reached 600 thousand tr. ounces in 2021, against this background the metal showed a price increase of 42% to a maximum in 16 years.
Source: Johnson Matthey, Gazprombank CEP calculation
The upward trend in palladium demand is expected to continue in 2018-2020, while palladium mining will remain stable. The metal shortage will keep palladium prices high.
The rise in price of palladium will stimulate its replacement with platinum
According to GFMS, platinum's chemical properties are more suitable as an autocatalyst in gasoline engines than the currently used palladium. The use of palladium by automakers is explained by the long-term cheapness of this metal relative to platinum in 2002-2016. Partial substitution of platinum by palladium and palladium by platinum in the automotive industry has already occurred twice between 1990 and 2008.
We expect that high palladium prices will encourage the replacement of this metal with platinum in the manufacture of autocatalysts for gasoline engines. According to industry participants, automakers have already begun testing autocatalysts for gasoline engines with full and partial replacement of palladium with platinum.
WPIC estimates that 20% of palladium consumed in the North American auto industry and 5% in Western Europe could potentially be replaced by platinum. With this development of events, annual platinum consumption will increase by 500 thousand tr. ounces (6% of total platinum consumption in 2021). This allows us to expect the prices of platinum and palladium to level out.
Platinum production: Expectation of production growth in 2021 limits price upside
In 2021, about 60% of the world's platinum producers made losses. According to preliminary data, global platinum production in 2021 increased by 1% to 6.1 million tons. oz. Most platinum producers predicted a decline in output, mainly due to the closure of unprofitable enterprises, but the attractive exchange rate of the South African rand allowed South African enterprises to increase output by 3% to 4.2 million tr. oz.
Source: WPIC, Johnson Matthey, Gazprombank EPC calculations
In 2021, several projects with a total capacity of 0.5 million tons will be launched in South Africa and Zimbabwe. ounces of platinum per year. Increased platinum production amid lower consumption in the jewelry and automobile industries will prevent significant price increases.
Platinum Jewelry Demand: The popularity of platinum jewelry in China continues to decline
Consumption of platinum in the jewelry industry, thousand tr. ounces
Source: Johnson Matthey, CEP calculations
Jewelers in China, which account for 55-68% of platinum consumption in the global jewelry industry, reduced their consumption of the metal by 14% in 2021 to 1.3 million tr. oz. A campaign to combat corruption and luxury by government officials in China has led to a decline in consumption of platinum jewelry to its lowest level since 2008.
Participants in the Chinese jewelry market also point out that the country is experiencing a shift in consumer preferences in favor of gold jewelry. As a result, Chinese jewelry enterprises are reducing the production of platinum jewelry and increasing the production of gold jewelry. We expect the downward trend in platinum consumption by jewelers to continue in 2018-2019.
SILVER MARKET
Dynamics of silver prices, dollars/tr. ounce
Source: exchange data, calculations by Gazprombank Central Electronics Center
Silver demand: solar energy development will be a key driver of consumption in 2018-2022.
Manufacturers of solar energy components increased their silver consumption by 11-14% per year in 2010-2016. In 2021, their silver purchases increased by 20% to 92 million tr. ounces (9% of total silver consumption) and accounted for up to half of the increase in global silver consumption in 2021.
In 2016-2017 The number of solar power plants around the world has increased, which remain profitable and competitive even without government support. At the same time, the governments of the largest countries continue to encourage the construction of power plants using renewable energy sources, such as solar and wind, by providing subsidies, tax incentives and guaranteeing the sale of products.
Consumption of silver in the production of solar power plants, million tons. ounces
Source: CPM Group, Gazprombank CEP calculations
The International Energy Agency (IEA) predicts an increase in electricity generation from solar power plants by 3.5 times from 303 TWh in 2021 to 1096 TWh in 2025 in the world. Global investment in solar and wind power plants exceeds investment in traditional power generation, and actual new capacity construction data exceeds the most optimistic forecasts made 3, 5 or 10 years ago.
Silver consumption is likely to lag behind the pace of solar panel production due to the downward trend in its use in manufacturing. The struggle to reduce the cost of solar energy led to a decrease in the specific consumption of silver per 1 GW of installed capacity of a solar power plant by 43% in 2011-2016. Silver market participants note that in 2021, the downward trend in the specific consumption of the metal in solar energy has practically ceased.
Structure of demand for silver in industry, 2016
Source: GFMS, Gazprombank CEP calculations
The growth in silver consumption in solar energy significantly exceeds the decline in demand in the production of photographic materials. We expect total industrial silver consumption to grow by 2-3% in 2018
Consumption of silver in the global jewelry industry (20% of total consumption) increased by 1% in 2021. The increase in consumption will be driven primarily by the economies of North America and Western Europe, whose sustainable growth rates allow us to expect an increase in silver consumption in the jewelry industry by 3-4% in 2018
We expect the price of silver to rise from $17/t. ounces in 2017 to $20.5/t. ounce against the backdrop of faster growth in silver consumption than its production.
Silver supply: production will decline due to low industry capital expenditures
Global silver production decreased by 2% to 870 million tons. ounces in 2017. The downward trend in production began in 2021 and is associated with low investments in non-ferrous metallurgy and silver metallurgy in 2012-2016. The importance of investments in non-ferrous metallurgy is due to the fact that the bulk of the metal (70%) in the world is mined as a by-product from deposits of copper, zinc, lead and other metals. The downward trend in production is likely to continue in 2018, which will drive silver prices higher.
At the beginning of 2021, 670 million tr were stored in the warehouses of ETF funds. silver, which is comparable to 65% of global silver production per year. Investor demand for silver depends to a greater extent on money market factors (inflationary expectations, etc.) than on expectations related to the situation in the real sector. If part of the investment community decides to move money out of silver and into other more profitable assets, such as equity indexes, then funds will have to sell a significant amount of the metal. This could put significant pressure on prices.
Change in the price forecast for precious metals April 2018 to May 2021, %
The review was prepared by the Center for Economic Forecasting of GPB (JSC)
_______________________________
1 As part of the fight against corruption in China 2015-2017. More than 1 million civil servants were convicted.
2 Conspicuous consumption – spending on luxury goods with the primary purpose of demonstrating one’s own wealth.
3 Platinum is primarily used in the production of catalysts for purifying exhaust gases from diesel engines, and palladium is used in the production of catalysts for gasoline engines.
Global gold supply
At the end of the year, the global supply of gold increased by 1% to 4490.2 tons against the backdrop of a slight increase in production and stable supplies for recycling. In particular, gold recycling increased by 1% to a new high of 1,172.6 tons. Despite a slowdown in recent years, this is the tenth year of annual growth and the highest level of annual ore production on record. The global portfolio of hedge contracts decreased for the second year in a row by 29.4 tons, while in 2021 the decrease was 27.9 tons. The dynamics of world gold prices over the past three years have stabilized (Fig. 5, p. 10) at a fairly high level ($1150-$1350/oz).
Rice. 5.
Dynamics of gold prices on the world market in 2016–2019.
Gold market analytics and forecasts
The latest analysis suggests underlying pressure from factors that are keeping gold within a relatively narrow range. Despite the support it receives, gold cannot break out of the range.
| Analytics | Organization | A comment |
| ANZ | Australian financial group | “The macroeconomic backdrop for gold is deteriorating due to concerns over fiscal consolidation. But negative real yields and rising inflation should offset headwinds.” |
| Capital Economics | Analytical company | “We expect the price of gold to fall further over the next couple of years as long-term US real yields rise and reach $1,550 an ounce by the end of 2022.” |
| Heraeus Precious Metals | Processor and supplier of precious metal products | “A stronger dollar may keep gold at bay for a while, but the medium-term outlook for the market remains positive.” |
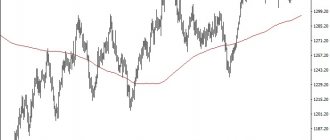
| Saxo Bank | Danish investment bank | “If gold moves well away from the 200-day moving average and recent highs of $1,825-$1,835, it will be able to diversify trading against the collapsed risk appetite in other sectors, and gold at $1,800 an ounce is a critical level of investors' risk tolerance.” |
| Sprott | Management investment company in the precious metals market. | “We believe the decline was a temporary reaction to a perceived change in the Federal Reserve's (Fed) stance regarding possible balance sheet contraction. In our opinion, the investment attractiveness of precious metals remains unchanged.” |
| TD Securities | Canadian Investment Bank | “Gold’s inability to rise, even amid existing concerns and record low rates, shows a lack of interest on the part of investors and an increased risk of another price pullback.” |
| World Gold Council | Trade and Industry Association | “The negative impact that rate hikes may have will likely be offset by longer-term effects and the unaccounted for effects of expansionary monetary and fiscal policies aimed at supporting the global economy.” |
Analysts at investment bank Jefferies have put forward a base case scenario in which the long-term price path for gold will be $1,500 per ounce, which implies a decline in prices from the recent range of $1,700-$1,800 per ounce. The bullish scenario sees the market strengthening to a peak of $2,500/oz, with a long-term target of $2,000/oz. According to the negative scenario, the price of gold will fall to $1,250 per ounce.
Analysts at ANZ bank expect the gold price to reach $2,000 an ounce by the end of September, but end the year at $1,950 and fall to $1,550 an ounce by the end of 2022.
When making forecasts, keep in mind that they may not be completely reliable. Conduct your own research to check the opinions of analysts and develop your own view of the market situation.
Demand for gold
According to the World Gold Council (WGC), the first quarter saw the weakest demand for gold in a decade. The influx of metal into investment bullion, as well as into traded exchange-traded funds, has decreased. Jewelry demand was quite stable. Central banks showed positive dynamics, mainly due to purchases by the Central Bank of Russia. Technology demand also continues to gain momentum.
East Asia, the Indian subcontinent and the Middle East represented approximately 65% of global consumer demand. India, Greater China (China, Hong Kong and Taiwan), US and Turkey represented more than half of consumer demand. A different set of socio-economic and cultural incentives drive each market, creating a wide range of factors influencing demand. Rapid demographic and other socio-economic changes in many key consumer nations are also likely to generate new types of demand for the foreseeable future.
Global demand for gold at the end of 2021 increased by 4% - to 4345.1 tons compared to 4159.9 tons in 2021, mainly due to increased purchases of the precious metal by central banks, which reached the largest volume in the last 50 years. Gold demand in 2021 is in line with the five-year average of 4,347.5 tonnes. The multi-year high in central bank purchases was 651.5 tonnes, which was 74% higher than 2021. The volume of gold consumption in China increased by 5.73% and amounted to 1151.43 tons. Thus, China became the world's largest consumer of gold for the sixth year in a row. In the US, demand for gold in the jewelry industry increased by 2% and was the highest since 2009. The reason is income growth and an increase in online sales.
The structure of the gold market is facing an unprecedented wave of changes driven by evolving gold demand patterns, regulatory changes, new types of participants and innovation. How individual gold market hubs respond to these opportunities and potential threats will shape the gold trading landscape over the next decade and beyond. The market's demand profile continues to shift to the East, with China and India alone accounting for more than half of global gold demand in recent years. In addition, Asian countries are investing at all stages of the chain from production to processing and manufacturing. China is now both the largest producer and consumer, which is reflected in the country's desire to play a more influential role in gold trading and pricing. There is an undoubted shift in influence towards China and its market infrastructure, primarily the Shanghai Gold Exchange.
Russian buyers prefer silver items of lighter weight than in “fat” times
We specifically analyzed the gold segment of the market, since it is the largest. Thus, in 2021, the jewelry market was estimated at 270 billion rubles, of which 180 billion were for gold jewelry—that’s 66%.
The silver curve at the beginning of the 2000s repeated the “golden” curve, but what’s interesting is that during the crisis of 2008-2009, as well as in the crisis of 2014-2015, the situation with silver was not entirely similar to the “golden” one. In the year the production of gold products fell, the weight of silver products increased. But only in the first year of the crisis - for example, in 2014, 19% more silver jewelry was tested - weighing 251.8 tons versus 211.6 in 2013. Which is precisely explained by the fact that after the first shock, the buyer pays attention to cheap silver, and then, roughly speaking, there is no money left for it. Therefore, it is not surprising that the silver production curve then nosedives.
Another reverse trend is also interesting: immediately after the crisis, buyers again turn their attention to gold, while silver production continues to fall. Thus, the number of silver jewelry in the Russian Federation has continued to decline since 2014, when almost 60 million items were produced; in 2021, 33.6 million pieces were tested and branded, that is, almost two times less; in fact, the situation with silver repeats 2007. But if at that time 32.8 million products weighing 223.2 tons were produced, then 11 years later the weight of the produced products fell by almost 40 tons, which indicates a much lower solvency of the Russian buyer: focusing on his needs, namely the lower weight of the product, Manufacturers are forced to produce increasingly lighter, and therefore cheaper, jewelry.
Number of products from foreign manufacturers received in 2018 by the State Assay Supervision Inspectorate
| Product name | gold | silver | ||
| PC. | mass, g | PC. | mass, g | |
| Chains, bracelets | 99.395 | 578.449,32 | 3.334.806 | 21.216.624,33 |
| Rings | 168.721 | 576.512,85 | 2.573.200 | 11.519.680,39 |
| Earrings | 354.065 | 633.671,46 | 5.638.303 | 13.258.403,54 |
| Pendants | 78.929 | 136.235,52 | 2.833.674 | 8.016.387,95 |
| Watch | 39 | 1.347,49 | 4.458 | 165.258,27 |
| Other products | 5.852 | 31.359,52 | 502.911 | 2.867.168,75 |
| Household products (dishes, tableware, souvenirs, etc.) | 434 | 8.592,09 | 34.123 | 1.218.734,40 |
| Total | 707.435 | 1.966.168,25 | 14.921.475 | 58.262.257,63 |
Jewelry demand
Jewelry traditionally accounts for the majority of gold consumption. India is the largest consumer by volume, accounting for 29% of global demand. Gold consumption in India is supported by cultural and religious traditions that are not directly linked to global economic trends. The financial crisis of 2007–2009 had a significant negative impact on consumer spending. This has led to a decline in sales of gold jewelry, especially in Western markets and in the United States in particular. However, jewelry purchases in India and Asia have since recovered, and in China, gold consumption for jewelry has continued to grow. Demand for jewelry is driven by a combination of affordability and consumer desirability. They typically increase during periods of price stability or gradually rising prices and then decrease during periods of price volatility. A steadily rising price reinforces the inherent value of gold jewelry, an intrinsic part of its desirability. In some countries, including China and India, there is now clear and significant potential for future growth.
Sales of gold jewelry amounted to 736.29 tons. Compared to 2021, this figure increased by 5.71%. At the same time, consumption of gold bullion increased by 3.19%, amounting to 285.2 tons. Retro-style jewelry made of pure gold became a hit of sales in 2021.
Jewelry gets out of crisis
For the second year in a row, the Russian jewelry industry continues to emerge from the crisis peak into which it entered immediately after 2013. Jewelry, of course, is not an essential item; on the contrary, it is a prestigious product, and the luxury segment is known to be one of the first to suffer in troubled times. Consumers either stop buying these products or start buying less expensive gold jewelry and more silver jewelry. The dynamics of the jewelry industry directly indicate the growth or decline of the economy.
Thus, in 2000, 9.74 million pieces of gold products were tested and branded (24.6 tons in total), two years later there was almost twice as much, and the market continued to grow until the crisis of 2008: in 2007 it was tested and 48.5 million gold products for 130.3 tons were branded, a year later - 46.7 million gold products for 127 tons. And in 2009, the weight of branded products fell by almost half - to 68.2 tons. Both because the market itself has shrunk, and because in difficult times the consumer would rather buy a small piece of jewelry by weight than a heavy bracelet.
Number and weight of jewelry tested and branded
| Year | Gold products | Silverware | Platinum products | Palladium products | ||||
| quantity, million pcs. | weight, tons | quantity, million pcs. | weight, tons | quantity, thousand pcs. | weight, kg | |||
| 2018 | 31,85 | 59,57 | 33,6 | 180,91 | 15,59 | |||
| 2017 | 31,18 | 57,86 | 38,81 | 178 | 26,74 | |||
| 2016 | 27,11 | 51,66 | 41,34 | 183,48 | 12,46 | |||
| 2015 | 28 | 58,89 | 50,91 | 208,52 | 14,45 | |||
| 2014 | 38,64 | 99,44 | 59,57 | 251,78 | 13,79 | |||
| 2013 | 43,52 | 107,76 | 51,02 | 211,59 | 10,48 | |||
| 2012 | 38,47 | 85,94 | 50,88 | 199,23 | 11,61 | |||
| 2011 | 33,77 | 77 | 49,91 | 193,17 | 13,55 | |||
Investment demand
Since 2003, investor demand for gold has grown at the fastest pace. Between 2007 and 2011, the value of gold increased by approximately 534%. Numerous factors force institutional and retail investors to seek out and invest in gold. The key factor here is gold's ability to hedge against volatility and protect against risk. The positive price outlook is supported by expectations that growth in demand for the metal will continue to outpace supply. In turn, positive price expectations themselves became the reason for further growth in investment demand. The rise in investment demand has led to the emergence of new ways of investing, including selling bullion to online ETFs. There is now a wide variety of investment products on the market to suit both the private and institutional investor.
Application
Gold has always been a means of saving and protecting capital. Nowadays, gold is traded on exchanges and is added to investment portfolios as a means of hedging against volatile risks and inflation.
Countries around the world have used gold or silver in trade for centuries, and in the 18th and 19th centuries. pegged currencies to the price of these precious metals. The United States left the gold standard in 1971, but gold is still considered a generally accepted safe haven for investment.
Gold is the most traded of the precious metals; highly plastic, corrosion-resistant, convenient for long-term storage in bars and coins; jewelry making.
Only about 10% of gold is used in industry - in contrast to silver, which is widely used, with about 50% of demand coming from manufacturing sectors. ETFs and other financial products account for about 19% of gold demand, while central banks account for about 6%, according to the World Gold Council.
Technological demand
The use of gold in various electronic devices, industrial and medical applications accounts for approximately 12% of total gold consumption - an average of more than 450 tons annually. Gold has high thermal and electrical conductivity, along with great corrosion resistance. This explains why about two-thirds of all industrial demand is for the use of gold in electrical components. The use of gold for medicinal purposes has a long history, dating back to ancient Egypt. Today, various biomedical products take advantage of the metal's numerous properties, including biocompatibility as well as resistance to bacterial colonization and corrosion. Recent research has shown other uses for gold, such as as a catalyst in fuel cells, chemical processing, and pollution control. There is potential to use gold nanoparticles in advanced electronics, cancer treatment, etc. Consumption of gold for industrial production and other purposes increased to 105.94 tons, an increase of 17.48%.
Central banks
Central banks and multinational financial institutions (such as the International Monetary Fund) currently hold just under one-fifth of the world's land-based gold reserves as reserve assets (approximately 29,000 tonnes spread across approximately 110 institutions). On average, governments hold approximately 15% of their official reserves in gold, although the proportion varies from one country to another. The developed economies of Western Europe and North America typically hold more than 40% of their total external reserves in gold, largely as a legacy of the gold standard. Developing countries, by contrast, do not have such a historical legacy and therefore have much smaller gold reserves, typically holding approximately 5% or less of total external reserves in gold. However, looking into the future 10 or even 20 years in advance, we can say with a high degree of confidence that the volume of gold production will fall, since there are no longer any high-quality deposits of this metal left in the world.
Published in the magazine “Gold and Technology”, No. 2(44)/June 2019.
Should you buy gold?
There are a number of reasons why gold is considered the “core” of an investment portfolio.
- Gold as a store of value
Gold has always been used as a store of value. This precious metal retains value over time, unlike fiat currencies, which fluctuate in value relative to other currencies and lose value over time due to inflation.
- Gold diversifies your investment portfolio
It is usually recommended to allocate 5-10% of an investment portfolio to gold or other precious metals - this is done to diversify and protect capital from the depreciation of other assets, such as stocks and bonds.
- Gold is a highly liquid asset
Gold is one of the most actively traded assets in the world and can be easily exchanged for cash. In addition, there is always a tight bid-ask spread, which is the difference between the lowest price a seller is willing to accept and the highest price a buyer is willing to pay.
- Physical gold can be inherited
Gold jewelry, coins and bars can be given as a gift or inherited. You can, after all, just wear jewelry without losing any of its investment value.