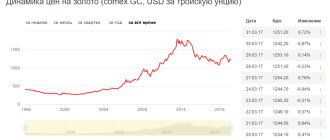
Palladium and rhodium prices have fallen sharply over the past two weeks after breaking through key support regions. From their spring highs they fell by 31% and 57%, respectively. The last two times palladium peaked were 2001 and 2008, and fell 66% in the following 12 months. Rhodium is more volatile in price, and after its last peak in June 2008, it fell 85% in its first year.
The recovery in demand after the pandemic, especially in the automotive market, does not match supply. Following coronavirus-related shutdowns last year, South Africa's PGM output is returning to "normal" levels, and despite supply cuts in Russia, refined palladium and rhodium production could see record year-on-year growth in 2021. However, ongoing supply chain issues in the automotive market and associated losses in vehicle production are significantly hampering the recovery in demand for palladium and rhodium from the automotive sector this year, putting pressure on prices.
The impact of the global semiconductor shortage on passenger vehicle production is expected to result in a loss of about 7 million units this year, with the chip supply shortage peaking in the third quarter of 2021. Automakers' plans to catch up in the second half of the year are virtually doomed to failure, since the chip supply situation is not expected to improve. Compounding the problem are rising COVID-19 cases and slow vaccination rates in Southeast Asia, which is a key part of the semiconductor supply chain.
A loss of 7 million units would reduce demand by nearly 1 million ounces of palladium and more than 100 thousand ounces of rhodium this year alone, leaving the rhodium market oversupplied.
The chip shortage is estimated to continue into the first and possibly second quarter of 2022, which has also led to a significant reduction in the light vehicle production forecast for next year. Intel and Infineon, major semiconductor makers, have warned that the problem could persist throughout 2022. If the situation worsens next year, it could lead to a surplus in the palladium market and an increase in rhodium oversupply.
Demand for gold
Retail sales of gold and other jewelry in China increased 45% in the first eight months of the year, the strongest year-on-year growth of any major retail category, according to China's National Bureau of Statistics. Sales are expected to grow further in the fourth quarter of 2021 due to an increase in the number of weddings and favorable shopping days. A particularly popular period for buying gold is the national holiday at the beginning of October.
According to the World Gold Council's latest report on the Chinese gold jewelry market, this year has seen a surge in popularity for chunky traditional Heritage gold jewelry, which can fetch more than a 20% premium over conventional gold jewelry, especially among younger consumers embracing the modern "Guochao" trend.
Previously, a lack of emotional connection to gold was considered a major obstacle for young Chinese consumers, but the trend appears to be changing.
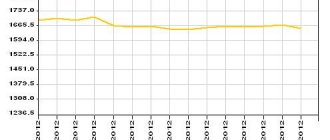
Year-on-year growth in gold jewelry demand in China will be a record, albeit from the lows of 2021 (413.8 tons). However, according to the forecast, it could reach or even exceed the 2021 level (638 tons (source World Gold Council)). The price of gold fell again last week due to the strengthening of the US dollar.
What metals are called precious
Precious metals are the name of a group of 8 chemical elements that have similar characteristics. They:
- rare - content in the earth's crust is millionths or even billionths of a percent;
- expensive - their rarity complicates their extraction; to obtain a gram of precious metal, tons of ore are sifted, some have to be separated from the ore chemically;
- stable - all precious metals do not oxidize well and retain their appearance for a long time, for this they received the second name noble.
Gold and silver were the first precious metals that people became familiar with many thousands of years ago, as they are often found in nature in the form of nuggets. Initially they were used as jewelry, and over time as money. Thus, two noble metals that are still popular today have become a symbol of wealth.
Around the 16th century, platinum joined the list of precious metals. At first, no use could be found for platinum; it was simply used to counterfeit gold and silver coins. French jewelers were the first to make jewelry from platinum. After the discovery of large deposits in Russia in the 19th century, money also began to be made from platinum. True, this practice lasted only 20 years.
I think everyone knows that gold, silver and platinum are precious metals, but there is no fact about their features and properties:
Gold is element No. 79 ( Au , aurum) in the periodic table, a noble metal of yellow color with a natural shine. It practically does not enter into chemical reactions, does not oxidize and does not corrode - thanks to this, gold products can be preserved for centuries. Melts at 1050°C. The density of gold is 19.3 g/cm³ - 2.5 times heavier than iron, but much softer, easily forged and deformed.
Silver is element No. 47 ( Ag , argentum), a gray-white precious metal. In literature it is used against vampires and other evil spirits, but in the real world it is valued for its high electrical conductivity, chemical resistance (though not as strong as gold) and unique reflective properties. The density of silver is 10.5 g/cm³, the hardness is the same as gold. Melts at 960°C.
Platinum is element number 78 (Pt, platinum) in the periodic table. Outwardly it looks like silver, for which the Spaniards called it platina, translated as silver. It is known as a metal that is more expensive than even gold, but today it costs almost 2 times cheaper. It has a high density of 21.5 g/cm³ and a melting point of 1800°C. In addition to jewelry, it is used in filtration devices for automobile gases and as a catalyst in the chemical industry.
Palladium - element No. 46 (Pd, palladium). Named after the asteroid Pallas, discovered during the study of platinum ores. The color is slightly lighter than platinum, and has a lower density of 12 g/cm³. The melting point is also high - 1550°C. 80% of the metal is used in cars; palladium filters some substances better than platinum and is gradually pushing it out of the market. These days, it is the most sought-after platinum metal, which has tripled in price in just a few years.
Rhodium - element No. 45 (Rd, rhodium), a silver-colored precious metal. The name comes from the ancient Greek rose - rhodium compounds have a dark red color. Density 12.4 g/cm³, melting point 2000°C, hardness 6 on the Mohs scale. Rhodium is also the most expensive precious metal, more than $3,000 per ounce. The reason is the same as for palladium - high demand in the automotive industry.
Iridium - element No. 77 (Ir, iridium), a noble metal of silvery-white color. Translated from ancient Greek, iridium means rainbow; this name was given to the metal for the various colors of its compounds. Density 22.5 g/cm³ (one of the heaviest metals), melting point 2500°C, hardness also a record 6.5. It is extremely rare in nature; its high concentration in the rock indicates its cosmic origin. The price is approximately equal to gold. Iridium is used in heat-resistant alloys, and you've probably heard of pens with iridium nib.
Ruthenium is element number 44 (Ru, ruthenium), another silver-colored metal. Named after Russia, where it was first discovered in platinum ore. Density 12.5 g/cm³, melting point 2300°C, hardness 6.5. It is used in heat-resistant alloys, electronics and as a catalyst for chemical reactions. A troy ounce of ruthenium costs $250, it is the cheapest metal of the platinum group.
Osmium - element No. 76 (Os, osmium), a silvery-white metal with a blue tint. One of the few metals that smells - alas, not of roses, more like chlorine. Osmium is a record holder in all respects: it is the heaviest metal in nature with a density of 22.6 g/cm³, melts as much as 3000°C, and has the highest hardness among noble metals - 7 on the Mohs scale. It is used in heat-resistant alloys, as a coating in friction units, and as a catalyst for chemical reactions. Costs $400 per ounce.
Of all the platinum group metals, only palladium is mined in large quantities; the rest are extremely rare and are used in narrow areas. Therefore, when we talk about the precious metals market, we are talking about: gold, silver, platinum and palladium.
Demand for silver
The future of silver in solar energy is a strong incentive for new projects to mine the silver metal. New silver projects are expected to emerge over the next few years based on long-term demand fundamentals from the global transition to clean energy as smaller producers are keen to benefit from rapid growth in solar photovoltaic production. The Bowden Silver Mines project in New South Wales is one such project and one of the largest undeveloped silver mining projects in Australia with an initial annual production of 5.4 million ounces of the precious metal.
The photovoltaic sector is forecast to be a growing source of industrial demand for silver over the next decade. It accounted for more than 100 million ounces last year, about 20% of global industrial demand.
The price of silver is still underperforming the price of gold, but it has already approached the support level. If the price falls below the $22 dollar mark, it will become a bearish sign.
How the precious metals market works
In the precious metals market, as in the foreign exchange market, there is no clear centralization. The process involves representatives from various sectors of the economy and of any caliber - from central banks and corporations to ordinary investors. It is also worth separating the primary and secondary markets for precious metals.
The primary market trades metal extracted from mines and mines. Naturally, it is difficult for an ordinary person to gain access to this market. Participants in the primary precious metals market:
- mining companies - producers of precious metals that purify ore from slag and obtain low-grade metal concentrate;
- refineries - completely purify the metal concentrate from impurities and produce ingots, powder or granules of high purity;
- industrial consumers - corporations that use precious metals in production (automotive industry, electronics and other areas);
- institutional investors - central banks, commercial banks, authorized bodies, etc.
On the secondary market, precious metals can be purchased in both physical (bars and coins) and virtual forms (online trades, stocks, futures, ETFs, etc.). Access to virtual trading for private investors is provided by commodity exchanges, which organize the trading process, unite buyers and sellers in one system, and set prices. The most famous is the London precious metals market, whose quotes are used to guide market participants around the world. In practice, investors often invest in precious metals through intermediaries - banks, brokerage companies or investment funds.
The history of the precious metals market goes back several thousand years. Up until the 20th century, gold and silver were used as money or as collateral for modern paper currencies. After the final price in the 1970s, prices on the precious metals market began to float freely. Ten years later this led to interesting developments. Some Hunt brothers had an idea to monopolize the silver market; for several years they bought the metal on an industrial scale. There was a rush on the exchanges for all precious metals, prices rushed up. As a result, the return on investment in each of the metals in 1979 alone exceeded 100%. Not bad, right?
As usually happens, the market bubble burst and prices collapsed (bankers and the US government contributed to this):
You can obtain historical data on precious metals prices, as well as original charts in Excel, at the following link:
Calculations and graphs for the article “Investing in precious metals”
The second metal boom essentially lasted for 10 years, from 2002 to 2012. It seems to me that it was during this period of investment that precious metals became firmly entrenched in the minds of investors as protective assets. There have been two major recessions in the markets in the 21st century—the dot-com stock market crash of 2001 and the global financial crisis of 2008. Disappointed investors were looking for safe haven assets and many chose to invest in precious metals, which by their nature do not lose value and rise in price well in crisis years:
As in the 1980s, the biggest gains were made in silver, with gold lagging slightly behind. Platinum and palladium performed worse, especially in 2008 - these metals are heavily tied to the automotive industry, which also suffered during the crisis.
As you can see, choosing a precious metal for investment is a controversial issue, because each of them has its own pros and cons.
Platinum
China's platinum trade data looks optimistic, but retail sales tell a different story. In the second quarter of 2021, total platinum transaction volume through the Shanghai Gold Exchange increased 70% year-on-year to 17.0 tonnes, a new quarterly high. In the first half of the year, total platinum transaction volume increased by 20% year-on-year to 28.9 tonnes. Customs data showed that net imports of the platinum metal also increased by 68% YoY to 32.6 tonnes in the second quarter of 2021. However, according to the latest survey from Platinum Guild International (PGI), retail sales of platinum jewelry in the second quarter of 2021 China (according to PGI's retail partners, which accounts for about a third of total retail sales) was down 15% year on year. Gold products have taken the spotlight in line with the trends described in the comments above, and the lower price of the gold metal has weakened platinum's cost advantage.
Demand for platinum jewelry in China is forecast to grow 16% year-on-year to approximately 880 thousand ounces in 2021, but will remain on a downward trajectory over the next few years as the outlook is clouded by increasing competition from other jewelry categories such as like gold) and a reduction in the number of marriages.
The apparent discrepancy between trade data and retail jewelry sales can be explained by increased demand for platinum from industrial end users in China, which is expected to reach a record level of over 800 thousand ounces this year. The price of platinum also fell last week. The market shows a significant surplus (excluding investments), which is reflected in the price below $1,000 dollars per ounce.
Posted by Heraeus Precious Metals September 20, 2021 | Translation: Gold Reserve
London fixing – guaranteed 20 pips per day
Hello, dear friends!
Today I propose to take a closer look at the term “London fixing” and evaluate its impact on the behavior of foreign exchange markets. I have worked with history, identified certain patterns and am ready to share them. Let me get ahead of myself a little - if there are trading techniques on the market that are close to the Grail, then trading taking into account fixing definitely falls into this category. With almost 100% probability you can take at least 20 points daily.
What is fixing and how does it affect the market?
First, let's look at the very concept of London fixing. This term refers to a special method of organizing trading in assets (this can be currencies, precious metals, and commodities).
Before the start of trading, those wishing to buy or sell an asset submit applications indicating the purchase volume. Then comes the trading phase, the manager balances the ratio between the volumes of buyers and sellers, adjusting the price. If the volume to buy is greater than the volume to sell, the price of the asset increases, if on the contrary, it decreases. During the trading phase, participants can submit new orders.
As soon as a balance is reached between the volumes for buying and selling, fixing occurs, at which time the price of the asset is fixed.
According to a similar scheme, prices of currencies, gold, and other assets are fixed. Next, I will consider examples only with the British pound for the reason that gold requires a fairly large deposit. I think most of you have capital up to $1000-$1500, under such starting conditions it is better to work with currency pairs.
Let's move on to the main thing - the pattern that allows you to earn money. I noticed that in most cases events develop according to the same pattern.
During fixing, a range is formed. Most often, there is a rapid exit beyond its upper or lower limit.
After this, a reversal occurs and the chart moves at least 20 points in the new direction. Sometimes the price covers a distance of 50, 70 and even 100+ points after the reversal. These are the movements I try to take.
Even with this, not the most favorable development of events, we can take a minimum 20 points of profit
In this example, the profit was already 40 points
I won’t lie—sometimes misfires happen. It happens that after a reversal and obtaining an entry point, the chart passes not 20 points, but 10-15, but if you are not greedy, losses occur very rarely. From my own experience I can say that 8-9 transactions out of 10 are closed with a profit.
New trading techniques will be discussed in more detail at the intensive course. I decided to reconsider the training format, so we immediately start with practice, gaining a theoretical foundation along the way. Intensive is useful both for those who are already working profitably using the Sniper strategy, and for those who are just starting to trade. Follow the link below for more details and a registration form.
Sign up for intensive
Let's move on to practice - how the pattern works
Even at the stage of developing the rules of this trading technique, I tried different approaches - both purely mathematical and a combination of London fixing with the Sniper strategy. Looking ahead, I will say that the best result was obtained with a combination of fixing and Sniper rules.
Using a purely mathematical approach, I tried to work with levels of 200 and 300% of the width of the London fixing range. You can determine them either using Fibonacci levels, adding the necessary levels through the settings, or manually, measuring the width of the range and putting it aside in the direction of the breakout.
Experiments have shown that reversals often occur precisely at these levels. Pivot points give entry signals (let me remind you that we do not take into account the first movement, but wait for a change in the direction of movement).
Please note that the reversal occurred exactly at 300% of the range width. Immediately after this, movement began in a new direction
The entry point was formed directly during the preparation of this material. And again the reversal occurred at exactly 300% of the range width
Yet the purely mathematical approach was prone to inaccuracies. Out of interest, I calculated how many entry points are lost - in a couple of years, with this technique, a trader would have missed about 30-40% of the generated signals. The win rate remains high, but the intensity of trading and profit in money decreases significantly.
Using London fixing in combination with Sniper shows much better results. It is possible to take most of the turning points after exiting. Standard Sniper patterns and level determination techniques are used.
Let's look at real examples:
- the chart breaks through the upper limit of the range and turns around at the level built using the Sniper system. A re-entry might have been required here, but in the end they could have taken their 20 points;
A clear turn on a level built according to the rules of the TS Sniper
- a similar scenario, but here a reversal followed immediately and 19 points could be earned in 14 minutes;
Another reversal on the level
- and again we have a chance to earn 22 points with a perfectly accurate reversal from the resistance level;
The reversal occurred with point-to-point accuracy
- and now real examples of trading. I was greedy with my first purchase and ended up closing it with a symbolic profit of a couple of points. But with the second deal everything worked out perfectly. Pay attention to the accuracy of the entry, this is a minute chart, but despite this, purchases were made at the very minimum;
Examples of transactions
- Here I used a pending order and was right. The chart touched the sell limit order, passed a couple of points against me and then turned around, and as it moved, I topped up.
Sales at maximum
I can give dozens of similar examples; I make deals using this technique almost every day. But the best way to tell about the effectiveness of trading are reports; below are statistics for a short period of time.
Trade statistics
I specifically took as an example not the best period of history, but here too the profit consistently exceeds the loss. Please note that I change the lot depending on the strength of the signal, so the results of the transactions vary greatly in terms of money. You will be able to trade with at least the same efficiency.
I'm sure by now you have the idea that trading using the London fixing is very simple and you are partly right. If we take only the technical component, then market analysis is extremely simple. The main difficulty lies in developing rules. We need clear rules for identifying a reversal after leaving the fixing range, supporting transactions, taking profits, topping up, and the possibility of re-entering the market.
The only way to solve these problems is to work with history. It took me more than six months; in the fall of 2021, I began working closely with this idea and only recently completed my research.
Those who feel a research streak in themselves can try to follow my path. If you don’t want to do science, but just plan to make money, it is much easier to sign up for training and receive ready-made rules and a description of the trading methodology.
In total, the training will include 6 live trading sessions, 24 hours of work with pros and 2 scalping techniques based on the Sniper Pro strategy. Let me emphasize once again - we start trading right away, we don’t waste time on dry theory.
Sign up for intensive
Conclusion
Due to fixing, I was able to improve my win rate by 10-20% , and this is worth a lot. The quality of trading has increased, and hence profits.
As for you, I cannot tell you the exact amount that you can earn by trading using this method. But we can make an approximate calculation. Even with a working lot of 0.1 per day, on average you can earn from $20, per month – $400. This is the minimum for a 0.1 lot; in reality, the profit turns out to be higher due to the fact that many transactions bring more than 20 points of profit. And with money management, different options are possible.
This is why I am not exaggerating when I say that the London Fixing can radically change your trading. All that’s left to do is learn the rules and start earning money.