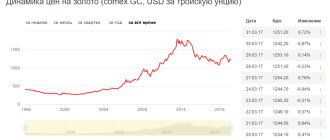
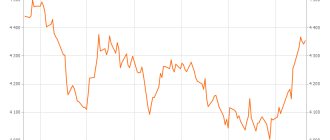
Last year, gold on world markets rose in total by 28%, taking into account average prices, and reached a price of $1,571.5 per ounce. Some analysts back in October-November last year, when there was a very rushed demand for the purchase of gold, hastened to make predictions that by the beginning of 2012 we can fully expect the price per ounce for this precious metal to rise to 2 thousand US dollars.
Dynamics of gold prices on the spot market in 2011
Overly optimistic forecasts rarely come true, but the dynamics of gold prices in February 2012 was positive. For example, on February 10, at auction in New York, an ounce of gold was quoted at $1,723.1; on February 13, the price for futures contracts here remained at $1,730.21. On this day, the Finmarket agency noted in its review that over the next 20 days, gold quotes will fluctuate within a range limited between “the levels of $1,720.03 and $1,733.10 per troy ounce.” In Russia, on the domestic market, prices in ruble equivalent for precious metals are traditionally determined in grams, and not in ounces or troy ounces, each of which contains a little more than 31 grams of high-grade gold (the exact weight is 31.1034768 grams). The discount prices for the yellow metal set by the Central Bank of Russia in February fluctuated as follows:
The maximum for February was 1710.57 (RUB/gram) 4.02, the minimum was on 11.02 - 1648.7 rubles. The average value for February was 1,672.18 rubles per gram.
We recommend reading: Gold price today
Why the price of gold is rising: main trends
In mid-February of this year, a trend is clearly visible: prices are rising, and it is quite possible that by the beginning of March they will reach the mark of 1,700 rubles per gram of gold. There are objective prerequisites for such a forecast, since the precious metals market is influenced by the strengthening of the European currency and a slight improvement in the situation in Greece. The active phase of protests by the population, who clearly do not like the curtailment of all social programs without exception, has subsided, the country's parliament has adopted a new, tougher economic program, and there is hope that Greece will receive financial injections from both the European Union and the IMF (International Monetary Fund). fund). And since, apparently, there will be no default in Greece, and the 130 billion euros promised to it will be provided, gold prices will continue to rise for some time.
By the way, observers attribute the decline in prices for gold futures in early February on the New York Stock Exchange precisely to the uncertainty of the then situation around Greece, since international financial assistance to this country was noticeably delayed.
When analyzing the dynamics of gold prices, international demand for it should also be taken into account. And demand, by the way, in 2011 was not just rushed, but reached an absolute maximum over the previous 14 years. The last time such a peak in gold demand was observed was in 1997.
We recommend reading: Gold market: overview
| Industry | 2010, tons | 2011, tons | Change, % | |
| Jewelry | 2016,8 | 1962,9 | -3 | |
| Industry | 466,4 | 463,5 | -1 | |
| Investments | 1567,5 | 1640,7 | 5 | |
| Bullions and coins | 1199,8 | 1486,7 | 24 | |
| ETFs and similar products | 367,7 | 154,0 | -58 | |
History of changes in the gold rate
Are you curious about the history of changes in the gold price? If so, we present a short retrospective of these changes in the past in order to understand the future.
Gold has always been subject to economic and geopolitical changes, so it is important for investors to know the precious metal's past performance to better understand how it will perform in the future.
By studying the history of gold prices, investors can understand when is the right time to invest in gold, as well as identify the factors that influence the price of the yellow metal.
Below is an overview of the gold price from a historical perspective, as well as its latest trends. It will determine the extent to which gold's past can illuminate its future.
Gold rate in the past
To understand the present, it is important to look at the past and evaluate what happened in the past, since our knowledge of the current state of the subject will depend on this knowledge. This method should also be applied to the issue of the gold rate.
In 30 BC. e. in the Roman Empire, 45 aureus (1 aureus - 7.3 grams) constituted one Roman pound (libra), however, as is known, people began to use the precious metal as a source of currency in 364 BC. e. In 211-217 AD. e. the price of gold in Rome rose to 50 coins per pound.
A major rise in the value of gold occurred in 306 AD, when Constantine the Great valued the precious metal at 70 coins per pound to finance his army. This was also a period of time when taxes were increased, and the first signs of hyperinflation in the economy were not long in coming.
Moving to the modern period in gold history, it is important to look at the monetary policies of the UK and US.
In 1791, when the yellow metal operated under the British gold standard, its exchange rate was set at US$19.49 per ounce. In 1834, the United States passed the gold standard and prices were fixed at $20.69. It was this method of gold fixing that created the conditions for the current position of gold; metal with a price per ounce that may vary based on certain circumstances.
The price of $20.69 an ounce and the gold standard lasted until 1933, being important factors in the Great Depression of 1929, which began after the Federal Reserve raised interest rates in 1928 and the stock market crash in 1929. After the crisis, investors began to buy gold as a protective asset, trying to exchange as much paper money as possible for it.
This forced the Fed to raise interest rates, fearing that the country might run out of gold. In turn, the value of the US dollar rose, indicating the beginning of the end of the gold standard.
In particular, the United States decided to leave the gold standard as the country faced rising unemployment and deflation rates.
In the early 1930s, the US government could not stimulate the economy further, so it was inclined to impose a ban on the population to cash out deposits and thereby deplete gold reserves. To reduce the damage caused by sharply rising interest rates, US President Franklin Delano Roosevelt severed the dollar's connection to gold in 1933, allowing the government to inject money into the economy while lowering interest rates.
In 1944, the value of gold changed again when several influential countries signed the Bretton Woods Agreement, which made the US dollar the official world currency, and the price of the precious metal was fixed at 35 US dollars.
Two other key years that are important for the history of the gold price are 1971 and 1976. In 1971, US President Richard Nixon made it impossible for foreign central banks to exchange dollars for gold. This decision completely decoupled the dollar from the gold standard, as Nixon wanted to address problems in an economy that was suffering from a combination of inflation and declining economic growth.
In 1976, the yellow metal was untied from the dollar and its rate skyrocketed to $120 an ounce on the open market.
By the end of 1980, traders bid up the price of gold until it reached US$594.92, using it as a hedge against double-digit inflation. Rising interest rates and rising inflation caused another recession, and eventually precious metals became cheaper on the open market.
The gold rate only remained around US$410 until the mid-1990s, when it fell sharply again to US$288 due to robust economic growth.
Gold came to be seen as a safe haven asset as it reached $869.75 during the 2008 financial crisis, then hit an all-time high of $1,895 on September 5, 2011, as investors expected the US to default on its debts.
Since then, the price of gold has been steadily declining, but its history is an important factor in determining the current trend and reasons for investors to purchase the yellow metal.
Gold rate today
There are many factors that can influence the price of the precious metal today. Currently, supply and demand, inflation, interest rates and geopolitical circumstances are the most important among them.
Supply and demand
Although supply and demand are not mentioned as often when discussing current gold price trends, they do play a role. Demand tends to push gold up when there is a threat to its supply. That's why investors who believe gold has peaked are so interested in the yellow metal - they worry that no more large deposits of gold will be discovered, so its supply will fall.
At the same time, demand turns out to be low due to low prices, as was the case throughout 2021 and at the beginning of 2021, when the metal fell seriously in price. This lack of interest from investors has led to falling and stagnating gold prices over the past year and a half.
Inflation, interest rates and geopolitical issues
These factors can be grouped together because they can influence the dollar, causing the price of the yellow metal to fluctuate. All three of these factors also relate to gold's role as a safe haven asset during periods of instability.
The past year and a half has seen an inflationary cycle that has caused the Fed to raise interest rates; this, in turn, has now pushed the US dollar index lower, leading to higher gold prices over the past few days. This is an example of how investors turned to gold when the economy was not doing well.
Geopolitical events such as trade wars also affect the price of gold. This is another circumstance that demonstrates the essence of the yellow metal as a defensive asset, and therefore makes it an attractive investment. Political instability spreading across the globe is negatively impacting the traditional asset market and also reducing the value of the US dollar. This is why investors are turning to gold as a safe haven. They buy the yellow metal in forms such as exchange-traded funds, gold bullion coins, bars and other products. All this leads to an increase in its rate.
It is worth noting that the value of the US dollar has increased sharply over the past two years. Even taking into account lower interest rates, political and economic problems, the market price of gold did not increase, since the US currency was not affected by all these factors. Currently, the US dollar is holding at high levels, and this is not doing very well for gold.
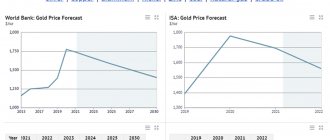
Prospects for the gold rate
Historical hindsight has shown that the exchange rate will follow a cyclical trend in the future. Although the factors that influenced the yellow metal during Roman times are not as significant to the spot price of gold today, history shows that market fluctuations always have an impact. In addition, given the current exchange rate of the yellow metal, investors will be able to understand what conditions are necessary for its growth and what circumstances will contribute to its fall.
If you want to invest in gold, then you need to determine what the market looks like at the moment and how the yellow metal and the dollar react to its condition. Keep in mind that history may repeat itself.
India and China buy the most gold
The World Gold Council believes that this phenomenon is explained by the recent increase in the attractiveness of investing in the precious metal (an increase over the year was noted at 5%), active purchases of gold from India and China, as well as from a number of central banks states seeking to replenish their gold reserves. The World Gold Council, summing up the results of 2011, announced that approximately $205.5 billion were spent on the purchase of gold weighing 4.06 thousand tons.
At the same time, almost 500 tons of the yellow metal were sold on the gold and jewelry market in India. In China, demand rose by more than 20 percent over the year, and in the investment sector by almost 70%. Legal entities and individuals, as usual, are trying to protect their future from ruin by accumulating gold.
We advise you to read: Gold of the highest 999 standard
Gold 2012 - Bubble or Good Investment?
In November, the rise in gold prices stopped, and in December the metal fell in price by more than 10% in a few days (to $1,530 per ounce). The main reason for the fall, apparently, is the need for liquidity of a large number of investment funds. The funds needed to sell significant volumes of gold positions, which (unlike other assets) have brought good profits this year. This happened against the backdrop of a temporary withdrawal from the market of the main buyers of gold - large investment funds.
Government demand did not have a decisive influence on the market, despite the fact that the central banks of a number of exporting countries bought a lot of gold in the second half of the year - sometimes more than 10 tons per month. Private investors and professional speculators, who bought gold in the hope of a depreciation of the euro against the US dollar and a fall in stock and commodity prices, felt that there may not be continued growth in the coming months. It is important that the purchase of gold by specialized “gold” funds—exchange traded funds (ETFs), through which most retail clients invest in gold futures—has ceased.
The total volume of physical gold on the balance sheets of such ETFs reached 1,300 tons in the US and EU: in 2011, they became the largest buyers of gold. And in total, investment funds specializing in gold, gold futures, options and other derivatives in the world today already have about 2,500 tons of metal - 1,000 more than two years ago. The market valuation of assets increased almost 2.5 times over the same period. At the same time, almost the entire increase in the volume of gold in the funds’ portfolios occurred due to the purchase of futures, and not an increase in the volume of physical gold. The situation is gradually beginning to resemble the explosive growth of the oil futures bubble before the market collapse in 2008.
Advertising on Forbes
What can we expect from a market that is filled with investor fears about instability in the EU and the coming rise in inflation, but at the same time does not see who will continue to buy precious metals? If the recognized financial market guru Denis Hartman is right when he said the other day that precious metals are “the biggest bubble of our time,” and the price of gold will soon fall to $1,475, then we can expect the metal to enter a bear market in 2012. True, Hartmann said approximately the same thing at a price of $1100 (maintaining long positions in gold even in the last six months).
The most reasonable version seems to be that gold in 2012, as in the previous six months, will correlate with “cyclical” commodities and the euro/US dollar exchange rate. Indeed, if you superimpose graphs of oil and copper prices, the €/$ exchange rate and the price of gold, you will notice that gold rose in price at the same time when investors, unsure of the dollar, began to buy futures for the most “reliable” raw materials, physical demand for which does not fall too much even in a recession. Consequently, gold purchases will resume when the US dollar begins to depreciate. And this, in the context of the debt and financial crisis of the eurozone, depends on the policy of the US Federal Reserve. If the next “quantitative easing” (QE-3) program in the United States begins in the first quarter of 2012, then a new decline in the US dollar (against the euro and especially against the currencies of commodity countries) will be inevitable.
How much will gold rise? In the previous year and a half, gold grew approximately three times faster than the US dollar fell against the euro. This year, gold prices have been most similar to oil and copper prices. However, during the EU recession and in anticipation of the transition to a new phase of the economic cycle, gold begins to behave differently than industrial raw materials. With the start of quantitative easing, it will grow faster than oil.
In a normal economic situation, where there is no panic or surprises, gold will move in a corridor, the width of which is determined mainly by fluctuations in the US dollar exchange rate. In 2011, the price of an ounce of gold has already experienced two cycles of rise and fall, with the maximum continuous increase over the half-year being more than $500 per ounce (until 1950), and the maximum drop - more than $400; we can expect an increase from last week's low ($1530) of at least $250 -300 during the first quarter.
The main factors that will influence the dynamics of purchases of physical volumes of gold by central banks in 2012 can be considered, firstly, the growth in gold production and the supply of precious metal scrap; secondly, the expected slowdown in purchases from jewelers (by 11%), primarily due to a strong decline in consumption in India. Only the retail investment segment, coins and bars, is likely to continue to show strong growth (up 29% year over year).
Interest in buying physical gold from the main buyers of recent years - ETFs will remain at a fairly high level, but is unlikely to reach the peak of 2010-2011. Professional investors will not continue to transfer funds from already greatly reduced shares and bonds into gold.
Therefore, the main thing that will affect the price of gold in the coming months is a new round of quantitative easing in the US (QE-3 program) and expectations of an injection of money into the market from the European Central Bank (at least €500 billion in the first quarter alone). If the printing press starts working in January, then gold will again reach the level of $1850-1900. Until this happens, we recommend focusing on the price corridor of 1600-1750.
World Gold Council Report: Gold Demand Trends 2012
Combined growth in demand from central banks and the jewelry industry in Q4 outpaced declines in the investment and industrial sectors, pushing overall gold demand to 1,195.9 tonnes, the highest in Q4, a near-record amount in value terms. at 66.2 billion dollars. Annual demand in 2012 reached a record of $236.4 billion, although in physical terms it decreased by 4%, to 4,405.5 tons.
Contents Key provisions Market overview in the 4th quarter of 2012 Global gold market - review for 2012 Jewelry Investments Industrial products Central banks Supply Gold demand statistics Appendix Notes and definitions
Gold Demand by Category (Tons) and Gold Price (USD/Ounce)
Basic provisions
Annual demand for gold in value terms increased in 2012 to an all-time record of $236.4 billion. In volume terms, demand was 4,405.5 tonnes, down 4% from 2011, as increased demand from institutional investors and central banks only partially offset the year-on-year decline in consumer demand. Below is a discussion of the most important topics of 2012, including India's dichotomous year, central bank buying reaching a 48-year high, and China's sustained commitment to gold.
Year in context
Viewed in the context of a longer-term perspective, annual gold demand was 15% higher than the previous five-year average, with most of this increase coming from the physical gold bullion segment of investment demand and central bank purchases, as shown in Charts 1 and 2 . The long-term downward trend in the jewelry and industrial sectors, coupled with twelve years of rising gold prices, contributed to the decline in overall demand, but in value terms, all sectors expanded significantly.
Chart 3 shows the ten-year trend in consumer demand by value (jewelry, gold bars and coins), which clearly shows that gold has captured the majority of wallet share. While 2012 saw a fall in the value of investment demand, the value of gold jewelry demand rose 3% to a record $102.4 billion (over a period in which the average dollar price rose more than 6%) , confirms the enduring interest in gold jewelry.
Diagram 1: Demand for gold by category Diagram 2 : Demand for gold by segment of the market segments of the market (2012, in tons) on average for 5 years (2008-2012, in tons)*
• Over the past five years, jewelry, industrials and ETFs have lost market share to bullion and coin investments and central bank buying.
*Average annual demand from 2008 to 2012 Note: Totals may not add up due to rounding
Chart 3 Jewelry Demand and Investment (Value) and Gold Price (USD/Ounce)
• Demand for jewelry reached a record high in 2012, extending the upward trend in the long term. • Investment in bullion and coins in value terms, having increased from $3.6 billion in 2003 to $76.6 billion in 2011, declined in 2012 but remained well above multi-year averages.
The amount of investment in bullion and coins increased significantly between 2003 and 2011, from less than $3.6 billion to $76.6 billion. One only has to look back a few years to find that investment demand was then only a fraction of the current one. level. Perhaps, therefore, in light of this significant historical growth, it is not surprising that demand for bars and coins declined in 2012, decreasing by 12% to $67.4 billion. In contrast, demand for gold ETFs was stronger in 2012 than in the previous year, 2011, which saw net outflows as investors profited from favorable pricing levels. The divergence between institutional and more retail-oriented elements of demand highlights the rationale behind the difference, which informs investor behavior in each sector and confirms our previous analysis showing that “the gold market is driven by a diverse set of factors, and that price is determined by the interaction of them, and that investment demand is not concentrated on one particular type of investor, but rather is a well-balanced and broad mix that includes many long-term holders.”
As 2013 shows, demand for jewelry is expected to decline in volume terms while prices remain high. Investment demand, which is somewhat dependent on changes in the price of gold throughout the year and the exchange rate influences local prices, should again exceed its multi-year average as investors remain focused on gold's role as a store of wealth. Continued innovation in gold investment products available in a number of countries (eg gold accumulation plans in India and China) confirms the healthy appetite for gold among investors.
India: two halves of one year
2012 was a mixed year for the world's largest gold market. Following the first half of the year, which saw consumers grapple with higher import duties, market turmoil in response to proposed gold import restrictions and sharp price increases in the domestic market, demand in India picked up strongly in the second half of the year. A sharp rise in prices in late summer, driven by rising consumer sentiment, ushered in a recovery period in the second half of the year. The market continues to thrive during Q4 wedding season and festive periods, especially during Diwali when demand for gold was particularly strong in urban areas. Demand was further stimulated, especially in December, by expectations (which later turned out to be justified) that the government would again raise duties on gold imports. This encouraged bullion dealers and jewelers to stockpile just before the tariff hike, and consumers planning to buy gold in the near future accelerated their purchases to avoid paying the increased tariffs in 2013.
Indian consumer demand (total demand for gold jewellery, bars and coins) in the first half of 2012 was 36% lower than in the first half of 2011. However, a comparison of the second half of the year with the second half of 2011 shows a 23% increase (although this comparison is somewhat exaggerated due to the relatively weak baseline period). As a result, for the full year demand decreased by 12% to 864.2 tons, which, however, looks more favorable compared to the 5-year average of 845.9 tons. Viewed in the context of a 21% increase in the average annual gold price in rupees (compared to an increase of only 6% in dollars), this result is even more significant, and underscores the importance of gold to Indian consumers. The annual demand amount reached 2,475 billion rupees, which is 6% higher than in 2011.
There are signs that frantic attempts to avoid higher import duties on gold continued in the early weeks of 2013 before the government confirmed it on January 21. However, the rest of the quarter may experience something like stagnation, as the market “digests” the increase in duties from 4 to 6% of the cost of imported bullion. Chart 4: Consumer demand in India (4Q 2011, 4Q 2012, five-year average, in tons) *
• Consumer demand recovered in the third and fourth quarters following a difficult first half of 2012. • Demand in the fourth quarter was 27% higher than the five-year quarterly average. *Average quarterly demand for five years from Q4 2007 to Q3 2012 Note: The sum of both demand categories may not add up to the total due to rounding.
China - keep it up!
Chinese gold consumers have shown remarkably consistent attitudes towards gold over the past two years, with demand for investments and jewelry unchanged throughout 2012 compared to quarterly figures in 2011.
Gold demand came under pressure from various opposing forces in 2012, ultimately resulting in quarterly year-on-year changes that were less than significant. Positive factors include: tailwinds from Chinese demand; continued urbanization of the population; the dominance of 24-karat (fine) gold and its role as a protected store of value; the increasing availability of gold investment products to the public with growing awareness of the benefits of gold investment, especially its role as a hedge against inflation.
On the other hand, Chinese consumers also faced headwinds as the effects of the downturn in the domestic economy caught up with them (although there were signs that things were turning around by the fourth quarter) and a period of extended consolidation in the gold price hampered demand from investors awaiting a clear signal to purchase.
Thus, Chinese demand in volume terms can be described as stable; The slight increase in investment demand was slightly overshadowed by moderation in jewelry demand. Total consumer demand was 262.7 billion yuan, up 3% year-on-year, as Chinese consumers continued to spend large sums on gold investment and jewelry purchases, with demand in both sectors reaching record amounts in 2012.
Looking ahead, there are signs of economic improvement, which bodes well for gold demand in China, although there are some signs that demand will strengthen rather than rise significantly. This will be the case if the price of gold remains within the range of the last 5-6 months. Chart 5: Consumer demand in China (4Q 2011, 4Q 2012, five-year average, in tons) *
• Chinese consumers maintained robust demand volumes compared to previous year levels, while demand in value terms exceeded 2011 levels.
*Average quarterly demand for five years from Q4 2007 to Q3 2012 Note: The sum of both demand categories may not add up to the total due to rounding.
Central banks: back to the breakthrough
Central banks collected a larger share of gold demand in 2012, accounting for 12% of total demand compared to a 10% share in 2011. Total net central bank purchases of 534.6 tonnes exceeded the already significant volume of 2011 and signaled a return to buying levels last seen nearly 50 years ago. During the year, new participants were added to the list of institutions replenishing their gold reserves; two of them were Brazil and Paraguay, both of which made significant purchases during the year.
Since the first net buyers emerged in Q2 2009, central banks have added nearly 1,100.0 tonnes to global gold inventories, nearly reversing the 1,143.0 tonnes of net sales made over the previous three years. Global gold reserves, according to IMF international financial statistics, have been growing steadily since the 1st quarter of 2009: as of November 2012 (latest data available), the total global gold reserve stood at 31,597.6 tons, an increase of 6% since the end of March 2009. .
Most countries actively adding to public gold reserves remain heavily concentrated in emerging markets, partly reflecting the scale of stockpiles growth in these markets in recent years. As these countries' government reserves grow, with a strong emphasis on the US dollar and euro-denominated assets, the need for diversification also increases. Gold, as a high-quality liquid asset and a desirable alternative, has a natural place as a share of these growing reserves. A number of studies have examined the characteristics of gold and its benefits as a reserve capital, as well as the optimal allocation of gold in a standard portfolio of reserve assets.
For a more detailed discussion of gold demand from central banks in 2012, see the commentary on central banks below.
Market overview in the fourth quarter of 2012
The recovery in certain elements of the gold market during Q4 saw demand reach 1,195.9 tonnes, the second highest amount for the quarter after the record in Q3 2011. Double-digit year-on-year growth in the jewelry and central banking arenas in Q4 was offset by lower demand in industrials and investment. Demand in value terms of $66.2 billion was also close to a record, second only to $66.7 billion in Q3 2011.
Most of the 11% increase in jewelry demand comes from India; Holiday and wedding season shopping was supplemented by trade restocking ahead of an expected increase in import duty, which was introduced a few weeks after the New Year. The recovery in demand for jewelry in the Middle East, following the devastating events of the past few years, also contributed to an increase in demand by 52.9 tons in this sector. Globally, jewelry demand hit a record $29.1 billion, partly reflecting a 2% increase in average dollar prices from Q4. 2011.
Central banks continued to make significant purchases, with Brazil, Russia and South Korea making a combined contribution of 70 tonnes, almost half of the 145 tonnes demand in Q4 2012. As stated above, the factors driving the central bank to buy should mean the sector continues to generate good demand over the next year. For a more detailed discussion of gold demand in the official sector, see the section on central banks.
Investment demand, although down 8% year-on-year, increased slightly compared to other quarters and remained well above the 5-year quarterly average in Q4. The year-over-year decline is partly due to the impact of Q4 2011, which was quite strong, but also reflects investors' hesitation in determining gold price cues during the quarter. The wide-range consolidation of gold prices over the past few months reflects the uncertainty that has been evident in investor behavior, particularly among the smaller and more retail-oriented investment communities where demand for bars and coins was relatively weak in the fourth quarter. India has been an exception, responding to the aforementioned prospects of higher import duties.
Given the lack of seasonality in investment demand, comparison over a longer period is more meaningful. Demand for bars and coins at 336.6t was 26% higher than the five-year quarterly average of 268.1t, while demand for ETFs was at the five-year quarterly average of 88.8t . This long-term analysis confirms the relative resilience of demand for gold investment products during the final months of 2012. While some markets lacked the fresh momentum needed to generate a strong surge in demand, general awareness of gold's appeal during times of uncertainty appears to have kept both the institutional and trading elements of the market at historically high levels.
The 3% decline in industrial demand to 100.9t largely reflects poor consumer sentiment in key markets, as well as ongoing substitution with cheaper alternatives. The decline was most pronounced in the dental sector, where demand was 7% lower than in Q4 2011 as gold continued to lose market share to base metals and ceramics. Demand for gold used in electronics fell 2% year-on-year, although this reflected as much a cyclical inventory shift as weaker demand for electrical appliances.
Good demand for tablets and smartphones outweighed further deterioration in demand for PCs and Ultrabooks. Gold continued to lose market share to copper in solder production, a trend that shows no signs of slowing down. Demand in other industries also lost 2%; Price-related decline in demand for jari (gold thread used in clothing) in India was the main factor behind the decline in this segment. Chart 6: Changes in total demand (Q4 2012 compared to Q4 2011, in tons)
• Demand from the jewelry sector and from central banks increased by 11% and 29% respectively, while slight declines in the investment and industrial sectors led to an overall increase in demand. • Q4 was the second strongest quarter for gold demand, at $66.2 billion in value.
Global gold market – review for 2012
Jewelry
Q4 was the strongest quarter for global jewelry demand since Q1 2011, as India and, to some extent, Middle Eastern markets fueled a recovery in the sector . The quarterly demand amount was 13% higher year-on-year at $29.1 billion. On an annualized basis, 2012 saw a 3% decline in quantity demand to 1,908.1 tonnes, primarily due to a relatively weak year in India. On the other hand, in value terms, demand for jewelry reached a record of $102.4 billion last year, up 3% from 2011, as consumers continued to spend large sums on gold jewelry despite 6 % price increase.
The two largest consumer jewelry markets, India and China, together accounted for 56% of total annual jewelry demand . India had a greater impact on the decline in demand over the year, for reasons discussed above. For more information on India and China, see the Fundamentals section.
Most other markets in the Far Eastern region showed weak demand for gold jewelry compared to 2011 . Thailand, South Korea and Vietnam all experienced significant double-digit declines for the year, primarily as a result of consumer reactions to price increases. Vietnamese consumers in particular were saddled with high markups in the local market, which suppressed demand.
The only participants with a positive trend within this group were Japan and Indonesia, although the comparison is made with a very difficult year for Japan due to the lingering effects of the devastating earthquake and tsunami in March 2011. Despite 6% annual growth in demand for jewelry in Japan, the market is on a downward trend over the long term.
Further declines in consumption in Western markets were also driven by consumer reactions to higher prices during a prolonged period of economic downturn . Italy suffered the largest decline among these markets, down 15% to 23.5 tonnes, as a dismal economy inevitably undermines demand. While silver consumption compares favorably with gold, it is interesting to note that the majority of it consists of gold-plated silver jewelry, confirming the interest in gold jewelry that is being undermined by the greater availability of silver.
Russia, the fourth largest jewelry market, saw an upward trend in annual demand in 2012 for the second year in a row . The market rose 7% to 81.9 tonnes, heralding a return to pre-global financial crisis levels. The relative stability of the domestic economy has protected Russian consumers in recent years, resulting in a 13% increase in annual demand in value terms, over a period in which the average annual price rose by 6%.
Among the Middle East countries, Egypt stands out, contrasting sharply with other markets in the region, with growth of 35% . However, it is important to note that despite significant growth over the year, the market has not been able to recover to pre-2011 political conflict levels. Double-digit declines in demand across all other Middle East markets were a reflection of rising gold prices, fueling a consumer shift to lower purity gold, gemstone products and, in some cases, lower-cost alternatives such as silver.
Turkish consumers have struggled to make modest progress in increasing demand for jewelry; an increase of 0.4% over the year rises to a record amount when translated into local currency - 6.8 billion Turkish lira . The typically weak fourth quarter of 2012 saw an 8% increase from the previous year as falling gold prices in the local market sparked a wave of buying in October and December. However, unfavorable weather conditions in the first quarter limited demand growth throughout the year. Demand in Turkey appears to be recovering from the turmoil of recent years, but it is still far from the dizzying levels of pre-crisis times. Pieces of lighter weight, lower purity (and therefore more affordable) continue to attract attention, reassuring us that any progress towards restoration is likely to be slow. Chart 7: Global demand for jewelry by region (Q4 2011, Q4 2012, 5-year average, in monetary terms)
• Demand in value terms broke quarterly and annual records. • Growth is concentrated in India, China and Egypt.
1. Average quarterly demand for five years from the 4th quarter of 2007 to the 3rd quarter of 2012 2. The rest of the world includes Russia and other countries Note: The total may not correspond to the sum of values due to rounding.
Investments
The decline in annual investment demand was the result of diverging behavior between institutional and retail investors . A 17% decline in demand for bars and coins, coupled with a 51% increase in ETFs and similar products, resulted in a 10% decline in investment demand. When adding the positive contribution of over-the-counter investment and stock flows (a measure of less transparent institutional elements of the market, as well as a statistical difference), total investment was 1,582.5 tons, 3% less than in 2011.
After slowing down during a sluggish second quarter, ETFs benefited from steady inflows throughout the rest of the year, with a rush of buying in Q3 on hopes of further easing in fiscal policy around the world . The total demand for ETFs in the amount of 279.0 tons amounted to almost $15 billion. OTC investment and stock flows were less resilient, fluctuating throughout the year in response to a number of factors. The main ones were: changes in the price of gold, political statements by various financial institutions and the economic situation in Europe. During the year, OTC investments and stock flows contributed approximately 47.8 tons to total investment.
Demand for bars and coins generated the lion's share of investment in 2012, accounting for 79% of total demand in the sector (excluding OTC investments and stock flows ). Demand for gold bars and coins, although lower than a year earlier, has nevertheless been very resilient over the long term, 31% higher than the 5-year average of 961.0t. To discuss demand for for bullion and coins in the context of the long term, see Fundamentals.
Despite a strong 4th quarter for Indian investment, the overall picture for the year shows a significant decline in the volume of demand for bars and coins in this market . As discussed above, the impact of a weaker first half of the year in India dominated the year-over-year comparison. Despite the robust level of gross demand for bars and coins, the combination of bullion dealers' increased profit motive and the disposal of inventory during the first six months of the year had the largest impact on net demand for the full year.
In China, the investment situation has changed little since 2011, although 265.5 tons shows a very good level of demand . Chinese New Year buying helped boost demand in the first and fourth quarters of the year, but investors were somewhat reticent due to the lack of a clear price signal for much of the year, given their preference to buy growth assets. For a look at gold demand in China throughout the year, see Fundamentals.
Elsewhere in the region, significant declines in demand in Thailand and Vietnam contrast with significant improvements in bullion and coin demand in Japan, resulting in a net decline of 15 tonnes in Far East markets.
Turkish investment showed a 34% decline in 2012, although this is a very unfavorable comparison since 2011 was a record year . The sharp rise in prices in the local gold market has created a strong desire for profit. This continued into Q4 as prices remained relatively high, although there were a few cut-price purchases in December. Annual demand was fairly close to the 5-year average of 52.7 tonnes, inflated by the 2011 record.
Europe's share of global demand for bars and coins fell in 2012 from 25 to 22%. However, 2011 was a record year, coinciding with the peak of the sovereign debt crisis, with demand far exceeding any previous figure in the region . Looking at demand in the context of a share that as recently as 2005 stood at 1%, the region continues to be a significant contributor to bullion and coin demand. While demand for bullion and coin holdings appears to be waning among high net worth investors, smaller investors continue to increase investment purchases with a dose of persistent security concerns in the euro zone.
In the US, the fourth quarter took precedence over a disappointing third quarter, supported by concerns over the fiscal cliff and the continued quantitative tapering of the Federal Reserve . However, for the year as a whole, demand of 53.4 tonnes was down 36% year on year, well below the high levels of the post-global financial crisis era. Chart 8: Investment Demand Trends (4Q 2009 – 4Q 2012, in tonnes) • The year-on-year comparison of investment demand partly reflects the slowdown in huge growth rates since 2008.
Industrial products
Annual demand for gold in the industrial sector fell by 5% in 2012 to 428.2 tons, also down 5% from the 5-year average of 453.1 tons . In value terms, demand increased dramatically compared to 2011, setting a new record of $23 billion, which is 48% higher than the 5-year average of $15.5 billion. While there were a few bright spots, the overall picture for the year is one of persistent decline in numbers with values holding steady.
In the electronics sector, demand decreased over the year by 5% to 302.7 tons . By value, demand was stable, increasing to $16.2 billion. As always, the fate of the sector depended on global economic conditions, in particular the challenges in Europe and the associated impact on demand for electronic goods in these key consumer markets. Smartphones and tablets accounted for the bulk of the growth, complemented by increased use of gold in industrial and automotive applications. However, this was not enough to counteract the decline in demand for PCs and ultrabooks, whose sales were significantly less than expected. The higher average price has triggered further losses in gold solder production, giving way to cheaper alternatives (copper and copper-clad palladium), thereby reinforcing the decline in quantities in the sector.
For gold demand in other industrial sectors, 2012 was a relatively weak year, with demand down 4% to 85.7 tonnes . Quantitative consumption in this segment has remained in a fairly stable range since the beginning of the century; Accordingly, demand was 6% lower than the 5-year average – 90.7 tons. A large share of the decline in demand is coming from India as the demand for jari (gold thread for decorating clothes) here has been hit by higher prices. This negative impact outweighs increases in China and Italy, where increased demand for gold-plated jewelry and costume jewelry has increased the consumption of electroplating salts (mainly potassium dicyanoaurate).
Gold used in dentistry declined for the eighth time in a row, again driven by an increase in the average gold price . Substitution with base metals (primarily cobalt-chrome) and, to a lesser extent, with ceramics, led to a decrease to 39.9 tons, or 8%. In value terms, demand decreased by 2% to $2.1 billion, although still above the 5-year average of $1.7 billion. Chart 9: Industrial demand by category in tons
• Despite growth in some areas, price-related declines, coupled with lower inventory levels, led to weakness in the industrial sector.
Central banks
Central banks around the world bought 145 tonnes of gold in the fourth quarter, the second-highest quarterly volume since the sector became a source of demand in the second quarter of 2009 . The 534.6t volume for the year represents the highest level of demand since 1964 as the list of central banks adding to their gold reserves expanded significantly to include Brazil, Paraguay, Iraq and Venezuela.
Russia stuck to its long-term
We are looking for an answer to the question, what to do with redheads in 2013?
It is high time for gold to be renamed from a “despicable metal” to a “capricious” one. In 2011, red (as businessmen call gold for its color) became the most profitable investment instrument, but in 2012 it was no longer so favorable to investors. However, other precious metals also behaved as well.
The accounting prices for precious metals, which are set by the Central Bank, indicate that gold in 2012 even fell in price - by 0.7% to 1,618.56 rubles.
Dynamics of accounting prices for gold in 2012, in rubles per gram
| Source - Bank of Russia, infographics - |
Other metals looked better against the background of gold. According to the Central Bank price tag, silver rose by 8.7%, to 29.44 rubles per gram. By the end of the year, platinum increased by 4.3%, to 1,491.12 rubles per gram. The price of palladium per gram was 687.46 rubles, which is 4.4% higher than at the beginning of the year.
Dynamics of accounting prices for silver in 2012, in rubles per gram
| Source - Bank of Russia, infographics - |
Dynamics of accounting prices for platinum in 2012, in rubles per gram
| Source - Bank of Russia, infographics - |
Dynamics of accounting prices for palladium in 2012, in rubles per gram
| Source - Bank of Russia, infographics - |
Experts are convinced that precious metals, in particular gold, in the current conditions are not an asset that can bring investors income.
Evgeny Ivanov, general director of investment:
The topic of precious metals will not change significantly over the course of the year. Gold and silver have been moving in the same price range throughout 2011 and 2012. Therefore, they can be used as a “safety cushion”.
Dmitry Timofeev , head of the manager’s analytical department, is not sure about this. In his opinion, all precious metals may fall significantly in price in 2013. As an example of a possible collapse of metals, Timofeev recalled the history of the price of gold as the most prominent representative of the group. According to the analyst, the price of gold is influenced by jewelry and investment demand.
“And here there is bad news for the precious metal,” says Timofeev. — India, which has been an active buyer of gold in recent years, due to sociocultural characteristics in the country, began to buy less. Net demand for jewelry in Western Europe is negative.”
Dmitry Timofeev:
Investment demand was high as investors feared the crisis and the second wave, as well as the possible consequences of the monetary policies of central banks in developed countries.
But firstly, since the autumn of 2012 there has been a growing awareness that Europe has overcome its problems and a second wave is no longer a threat. This puts pressure on gold prices as those who "hedged" against the crisis begin to sell that hedge. Secondly, statements that “printing” will lead to inflation have been going on since 2008. It is already the fifth year, but there are no signs of accelerating inflation either in the United States, or in Europe, or in any other country where central banks intervened in the market.
“With bets on the crisis and inflation not working, gold looks doomed to fall. It looks like this trend will become apparent in 2013. In the same logic, we do not like other precious metals,” the interlocutor sums up.