With the economy facing a deep recession, memories of the last global financial crisis have surfaced. This year has already been a tumultuous one for the gold market. What can we expect next?
Historical analogies with the Great Depression do not suit us in this case. The gold standard was still in effect at that time. Thus, gold prices rose only because the government devalued the US dollar, effectively confiscating all of the country's precious metal.
But using the example of 2008, we can determine what happens to gold during a recession. Let's look at what we already know.
Why did gold crash in 2008?
In the fall of 2008, much of the global banking and financial system collapsed. It was the worst economic downturn since the Great Depression began in 1929. In retrospect, it is safe to say that the American economy actually entered a recession at the end of 2007.
Gold prices rose for most of this intervening period. In 2007, the average spot price was about $700 dollars per troy ounce, showing an annual increase of more than 30%. This happened right in the midst of a decade-long bull run that began in 2001.
The trend was rapidly gaining momentum until the beginning of 2008. During the first quarter, the yellow metal set new nominal all-time highs (at the time), breaking $1,000 an ounce for the first time.
Then something amazing happened. From March 12-13 to October 2008, as the scale of the unfolding crisis became increasingly clear, the investment gold market experienced an increasingly erratic sell-off. (Meanwhile, on March 14, 2008, investment banking firm Bear Stearns was bought out and later sold to JPMorgan Chase.)
Prices fell to their lowest level in a year, $692.50 an ounce, following the collapse of Lehman Brothers on September 15, 2008. Overall, the value of the precious metal has fallen by about a third from peak to trough.
| Year | Closing price (average) | Price change (YoY) | Annual maximum | Annual minimum |
| 2007 | $696 | +31,6% | $841,75 | $608,30 |
| 2008 | $872 | +3,4% | $1023,50 | $692,50 |
| 2009 | $974 | +27,6% | $1218,25 | $813,00 |
| 2010 | $1227 | +27,7% | $1426,00 | $1052,25 |
| 2011 | $1573 | +11,7% | $1896,50 | $1316,00 |
*The above price data is based on the daily price of gold in New York, derived from the 100-year historical chart in MacroTrends.
The precious metal's decline in 2008 proved a barrier to reaching $1,900 an ounce three years later. But why did gold fall so much? Isn't it a safety asset in times of market stress?
In the midst of a selling panic, as we saw during the financial crisis, anything that isn't bolted to the floor tends to get liquidated. This means that liquid assets such as gold are often sold first. As a result, even precious metals followed the stock market lower within a few months.
Dynamics of gold prices over the past 10 years
Before looking at the gold price chart for the last decade in dollars, a few words should be said about previous events. After a grueling twenty-year correction in the early 2000s, the precious metal entered a global growth phase. From February 2001 to May 2006, the price of gold increased from $255 to $732 per troy ounce (i.e., almost 3 times). This was followed by a short-term pullback – to 546 $/oz. And by the beginning of 2007, quotes were near the $640 mark.
The price movement for the precious metal over the past decade can be divided into 2 phases. From January 2007 to September 2011, sharp growth continued. During this time, quotes increased by $1,284 (another 3 times). The absolute historical maximum price for gold was set on September 6, 2011 – $1923.7.
However, there were also significant downgrades. It occurred during the global economic crisis of 2008. In less than a year, from March to October, the price of gold plummeted from $1,034 to $681. This is not surprising, because in conditions of liquidity shortage, managers were forced to get rid of everything that could be sold. But it didn't last long. The precious metal came out of its peak earlier than many other assets and grew continuously over the next almost 4 years.
Experts explain this dynamics for several reasons. The main one is the easing of monetary policy by the US Federal Reserve. The key interest rate was sharply reduced. And in November 2008, the regulator launched the so-called QE1, a quantitative easing program, followed by QE2 and QE3. As a result, the US dollar began to decline against major world currencies, and investors, fearing inflation, traditionally turned to gold.
From September 2011 to December 2015, quotes for the yellow metal fell. The current low of this cyclical correction is $1,045. That is, gold fell by about 45% from its historical high. Whether the correction is complete is still an open question. But gold bugs are convinced that this asset should be worth much more. As of the end of March 2021, quotes for the precious metal are around $1,250.
The main reason is the same – the actions of the American regulator. It was not possible to accelerate inflation, the QE programs were curtailed, and the rate began to be raised. All this was accompanied by a credit squeeze. Similar dynamics have been observed in other commodity assets in recent years.
History repeats itself in 2021
This time we are seeing similar dynamics in the gold market.
During the worst stretch of Wall Street's selloff in mid-March, gold futures posted their biggest one-day losses ever in two straight sessions. For a short time, gold even traded below $1,500 an ounce. By the end of the month, prices had recovered to around $1,650, but by then it was becoming difficult to find the physical metal (gold coins) without paying a huge premium.
Volatility remains high. The swings in the markets were larger and faster than even in 2008. Given the uncertainty surrounding the coronavirus, this could continue for many months. Over the last four months of 2008, the VIX (CBOE Volatility Index) remained above 45.
However, the overall picture is again in favor of gold. Precious metals have traditionally performed well as a safe haven after a crisis. Note that the highest gold price in history was recorded in 2011, not 2008 or even 2009. The same is true for silver prices.
The lesson is that it can take years for the positives of a safe haven asset to emerge, especially if the world is mired in a prolonged bear market and the Fed is keeping interest rates near zero.
Taking a look at the history of gold prices over the last 10 years or so, a few things stand out.
| Year | Closing price (average) | Price change (YoY) | Annual maximum | Annual minimum |
| 2012 | $1669 | +5.7% | $1790,00 | $1537,50 |
| 2013 | $1410 | (27.8%) | $1692,50 | $1192,75 |
| 2014 | $1266 | (0.2%) | $1379,00 | $1144,50 |
| 2015 | $1159 | (11.6%) | $1298,00 | $1049,60 |
| 2016 | $1252 | +8.6% | $1372,60 | $1073,60 |
| 2017 | $1260 | +12.6% | $1351,20 | $1162,00 |
| 2018 | $1269 | (1.2%) | $1360,25 | $1176,70 |
| 2019 | $1393 | +18.8% | $1542,60 | $1270,05 |
| 2020 | $1603 | +12.8% | $1727,55 | $1472,35 |
*Until April 2020
The current gold market experienced a bearish trend for about six years starting in 2012. With the exception of a few short-term spikes to around $1,350 dollars per ounce, the trend was clearly downward, and then the price moved sideways.
The end of 2021 marked a turning point. Since then, prices have risen more than 33% to more than $1,600 an ounce.
Market timing, or determining the absolute peak or bottom of any market, is an almost impossible task. But identifying broader trends and cyclicality in order to draw some conclusions about the likely future behavior of gold is quite possible.
Below are three main conclusions from the analysis of gold price movements in 2008.
Gold is trading in a wider range than usual
In other words, volatility was increased, which is again true today. Although the precious metal made some big swings, it closed the year slightly higher than it started.
To understand what the price of gold will be in 2021, it is useful to express it as a range. Analyst Everett Millman expects the price of the precious metal to range from $1,400 to $1,750 per troy ounce this year.
Instead of guessing the exact price, it's better to use the target range as a guide. This is a more conservative approach, but it will make the analysis more robust by accounting for short-term volatility.
Gold was growing before the crisis
Every year from 2001 to 2007, the price of the precious metal ended in the green, when measured in virtually all major currencies.
As during the 2008 financial crisis, the price of gold has been rising well into 2021. The price of the precious metal has risen in four of the last five years. The only exception was 2021, when gold prices fell significantly, even in dollar terms.
Believe it or not, the precious metal has grown by almost 44% from 2021 to 2021. You may be wondering why you haven't heard of this before now!
Gold sold off several times ahead of sustained bullish rally
Rising prices over the past 12 months have paved the way for a consolidation phase. After such large moves, the price tends to move sideways and sometimes even decline as precious metals market participants digest the new information.
This suggests the precious metal could still test the channel bottom this year. The 2020 low is $1,475, but as the historical charts above suggest, back in June 2021, the $1,400 line was extremely resilient resistance. Until last summer, the price of gold had not risen above $1,360 an ounce since 2013.
World Gold Council Report: Gold Demand Trends 2013
2013: Global consumer demand for gold reached unprecedented levels. China has become the world's largest gold market
Consumers around the world bought record amounts of gold in 2013, with demand led by India and China, which has become the world's largest gold market, according to the World Gold Council's latest demand trends report. Consumer demand in Western markets remained strong, particularly in the US, where the past year was a strong year for the jewelry, bullion and coin sectors.
The gold market saw a 21% increase in consumer demand in 2013, which contrasts with an outflow of 881 tonnes of gold from ETFs. As a result, global demand for gold in 2013 decreased by 15% compared to 2012, amounting to 3,756 tons per year in physical terms.
Annual investment demand for bars and coins reached 1,654 tonnes, up 28% from 1,289 tonnes in 2012 and the highest since the World Gold Council began recording data in 1992.
For the year as a whole, Chinese and Indian investors invested 38% and 16% more in gold bars and coins, respectively. Despite the significantly smaller market size, demand for bars and coins in the US increased by 26% to 68 tons, and in Turkey by 113% to 102 tons, providing solid support at the global level.
Meanwhile, jewelry demand, another component of consumer demand, rose 29% from 519 to 669 tons in China, and 11% from 552 to 613 tons in India, reaching 2,209 tons globally, the highest ever. the highest since the start of the financial crisis in 2008.
Comment by Marcus Grubb, Managing Director of Investments, World Gold Council:
“2013 was a strong year for gold demand in all sectors and regions, with the exception of Western ETF markets. More precisely, 2013 became the year of the consumer. While demand continues to move from west to east, the growing appetite for gold bars, coins and jewelry is a global phenomenon.
All things considered, the statistics show the resilience of the market and the unique nature of gold as an asset class that rebalances with economic conditions.”
Key findings of the report:
- Consumers remain a key driver of gold demand . Globally, consumers bought 3,864 tonnes of gold last year, up 21% from 2012. Jewelry demand in China rose 32% to a record 1,066 tonnes, and in India up 13% to 975 tons
- Global consumer demand is increasing . Around the world, there has been a significant increase in consumer appetite for gold, in both emerging and developed markets. Demand in Turkey increased by 60%, in Thailand by 73%, and in the USA by 18%.
- Demand in India remains strong . Despite several import-related headwinds during 2013, gold demand remained buoyant, reaching 975 tonnes for the year overall, above the 2012 figure of 864 tonnes. We estimate that unofficial imports have nearly doubled since 2012 , compensating for the decline in official imports.
- Central banks . Despite a 32% decline from 2012, central banks remain stable buyers of gold, continuing a trend that began in 2009. In 2013, net purchases were recorded in all four quarters, amounting to a total of 369 tons, representing 12 consecutive quarters of net capital inflows.
- Exchange Traded Funds . There was a net outflow of 180 tons from ETFs in the fourth quarter as investors continued to reprice their portfolios in response to market conditions. In total, investors withdrew 881 tonnes from the ETF over the year.
- Industrial demand reached 405 tons in 2013, practically no different from the 2012 figures of 407 tons.
Statistics of supply and demand for gold for 2013
- Demand for gold in 2013 amounted to 3,756 tons, 15% less than in 2012.
- The average annual gold price was US$1,411 per ounce, which is 15% lower than in 2012.
- Global demand for jewelry is 2,209 tons per year, up 17% compared to 2012.
- There was a net outflow of 881 tonnes from the ETF as investors continued to review their portfolios.
- Net purchases by central banks amounted to 369 tons, which is 32% lower than in 2012.
- The total supply of gold for the year amounted to 4,340 tons, decreasing by 2% compared to 2012.
Statistics of supply and demand for gold for the 4th quarter of 2013
Consumer demand in China grew 4% year-on-year in the fourth quarter. Consumer demand in India fell 16% to 219 tonnes. Overall, global jewelry demand rose 6%, while demand for bars and coins fell 6%. Central banks were net buyers of gold for the 12th straight quarter, with ETF outflows totaling 180 tonnes for the quarter.
- Demand for gold in the 4th quarter was 858 tons, 29% lower than in the 4th quarter of 2012.
- The average quarterly price for gold amounted to 1,276 US dollars per ounce, having decreased by 26% compared to the 4th quarter of 2012.
- Global jewelry demand was 554 tons in the quarter, up 6% year-on-year.
- The consumer investment sector again saw strong demand for bars and coins, up just 5% to 327 tonnes compared to Q4 2012.
- There was a net outflow of 180 tonnes of gold from ETFs as investors continued to reprice their portfolios in response to market conditions.
- Net central bank purchases amounted to 61 tonnes.
- Demand in the industrial sector remained stable again at 96 tonnes, unchanged year-on-year.
- Total supply for the quarter was 1,124 tonnes, up 2%.
Gold demand trends in 2013
2013 turned out to be the year of the consumer, a year in which demand for gold jewelry approached pre-crisis levels and investment in small bars and coins reached record highs. The result was expressed in annual demand for gold in the amount of 3,756.1 tons, which in total amounted to $170 billion. However, impressive consumer demand is offset by ETF outflows and lower central bank purchases, resulting in overall demand down 15% in 2013 compared to 2012.
Basic provisions
The gold market has become polarized in 2013, with a 21 percent rise in demand from consumers and value-seeking investors contrasted by large-scale outflows from ETFs. This ultimately translated into an overall decline in gold demand of 15% in a year in which demand for jewelry, bars and coins reached an all-time record. Chinese consumers set a new annual record, while in India demand was subdued amid import restrictions. The sharp fall in gold prices in the second quarter triggered a strong and rapid response from consumers in Asia and the Middle East, which spread to Western markets in the final quarter of the year.
Activity in Q4 followed the same pattern as throughout 2013, with demand down 29% from near-record levels in Q4 2012. Annual gold supply fell 2% for the second year in a row as declines in refining activity outpaced moderate growth in production.
The sharp drop in gold prices in the 2nd quarter and the subsequent weakening of prices in the rest of the year had a noticeable impact on the amount of demand in total terms.
The average annual price of gold in a number of currencies, including US dollars, euros, British pounds and Chinese yuan, was almost 16% lower than in 2012. However, several key markets, notably Japan, India and Turkey, experienced marked price fluctuations due to significant currency depreciation ( Chart 1 ).
Closer to home: record year of consumer demand
Consumers showed impressive activity last year, increasing demand for jewelry, small bars and coins (collectively referred to as “consumer demand”) by 21% to an all-time high of 3,863.5 tons. Most of the growth came in the first half of the year, which is not surprising given the sharp drop in prices in April and June that sparked strong reactions from consumers in more price-sensitive markets such as India and China. This trend continued in the second half of the year as the impact of low prices was felt more globally, particularly in the jewelry sector. No review of 2013 would be complete without mentioning the unprecedented flow of gold from Western vaults into Eastern markets, via refiners in North America, Switzerland and Dubai. As we have detailed previously, this flow is a consequence of large-scale selling of tactical ETF positions among Western investors as sentiment in the US macroeconomy has improved. As a result, gold flooded the market and was used to satisfy the insatiable appetite for the physical metal among consumers in India, China and many Asian and Middle Eastern markets. These movements have seen the epic scale of 400oz London Standard (LGD) gold bars transformed into smaller pieces better suited to consumers' pockets.
In the fourth quarter, further outflows from ETFs continued, reaching 880.8 tons for the year as a whole. Three-quarters of those outflows were absorbed by a rise in annual consumer demand to 678.4 tonnes (the biggest year-on-year increase) and a demonstration of the strength of physical demand for jewelry, bars and coins.
China sets the tone...
Chinese gold demand set a significant new record of 1,065.8 tonnes for the year, exceeding our expectations. Previous editions of the Gold Demand Trends report discussed the strength of Chinese consumers' response to price changes in the second quarter, which was the quarter of greatest impact on annual demand figures. While this strong surge was naturally followed by some slowdown, demand picked up again during the fourth quarter as Chinese New Year, the traditional time for gift-giving, loomed.
The extraordinary growth in demand in 2013 had an impact on the Chinese gold industry, resulting in a significant expansion of both production and retail volume.
Following the onset of supply difficulties that hit the market mid-year and a massive drain on stocks mobilized to meet demand, it was concluded that the supply chain must be prepared for any gold rush of similar magnitude in the future. In this regard, in recent months there has been a slight accumulation of inventories throughout the chain, which is also increasing due to the expansion of the chain itself. During the Chinese New Year holiday in January, demand for gold consumer products appeared to be strong. Still, price expectations have stabilized and, as a result, demand growth in China should become more resilient, at least in the short term.
...as India overcomes import restrictions...
In 2013, Indian consumers again showed a strong commitment to gold, with demand of 974.8 tonnes marking the third-highest annual volume. This happened despite the government introducing a number of measures to curb demand. Higher import duties, tighter import quotas and restrictions on gold-backed lending and coin sales led to a decline in domestic supplies as the government tried to reduce the current account deficit.
When looking at Indian demand throughout the year, it is important to understand the impact of these particular dynamics on the domestic gold price. After falling sharply in April in line with the international gold price, the Indian Rupee price soon decoupled from the US dollar due to local currency weakness and supply/demand pressures. Once measures were taken to limit supply, markups rose, increasing already high (relative to international prices) local prices. Indian consumers thus lost the chance to buy gold at low prices in the second half of the year, unlike consumers in many other markets ( Chart 2 ).
Official statistics show a 63% year-on-year decline in gold imports between July and October (latest data available) following the introduction of government measures to curb gold imports. However, the Indian gold market is supported by several alternative sources, which include recycled gold, local production and unofficial imports. As the underlying demand level of Indian consumers remained high, the sharp decline in official gold imports in India led to an increasing number of cases of meeting this demand through imports through unofficial channels. This element of the market is inherently opaque and difficult to accurately quantify. Therefore, estimates of the volume of smuggled gold in India vary widely; Market analysts suggest that it is approximately 20-30 tons per month. While the Indian Finance Minister is much more conservative in his estimates, saying that in the second half of the year this volume did not exceed 1-3 tons per month. A Thomson Reuters report pegged annual shipments at more than 150 tons. However, our independent assessment based on market analysis suggests that these unofficial flows could be significantly higher. We previously settled on a range of between 150 and 200 tonnes for 2013, but we now assume that for the year as a whole, actual volume was closer to the higher end of that range.
Optimistically, measures to curb gold imports will have the expected effect of reducing India's current account deficit. Despite this, these restrictions will likely not be lifted until at least the end of the first quarter of 2014, and possibly beyond, keeping supplies from this source contained. Unofficial gold will undoubtedly continue to complement official inflows as latent demand from Indian buyers remains high. This is supported by consumer research commissioned by the World Gold Council, which shows that consumers in both India and China expect to spend as much, if not more, on gold jewelry this year as they did last year ( Chart 3 ). Regarding India, it should be noted that demand in the first half of 2014 may not reach the exceptionally high level in the same period of 2013 ( Figure 4 ).
... and in the 4th quarter the rest of the regions joined the competition...
While much of the year was concentrated in eastern markets, particularly India and China, the fourth quarter saw a noticeable recovery in consumer demand in western markets, particularly in the jewelry sector. Unlike eastern markets, jewelry consumers in Europe and the US did not react immediately to the sharp drop in prices in the second quarter. This is primarily because international price declines here take a longer period of time to be reflected in retail prices, unlike in India and China where prices are adjusted daily to reflect changes in market rates. However, a persistent low price environment coupled with improving consumer sentiment and the arrival of the main shopping season in Q4 led to a recovery in a number of Western markets.
The fourth quarter of sequential annual growth in U.S. jewelry demand generated annual demand close to levels last seen in 2010 and the first annual increase since 2001. Improved economic conditions have impacted retail sales and a return to higher purity items. Annual US gold jewelry imports rose for the first time since 2005, with significant increases in imports from India, China and Italy.
The UK market also showed an encouraging improvement in demand for jewellery, with consumers showing a strong preference for high-quality items. Birmingham Assay Office statistics show an increase in the number of items presented for hallmarking throughout the year. According to the data, "December...was particularly strong, with growth up to 30.9%...as the low gold price helped benefit consumers."
Global gold market – review for 2013
Jewelry
With the largest increase in annual jewelry demand since 1997, 2013 marked a return to pre-crisis levels . In Q4, the sixth consecutive quarter, demand rose year-on-year to 553.8 tonnes, 12% above the five-year quarterly average.
Throughout 2013, the sector experienced constant growth, the bulk of which occurred in the first half of the year. In Fundamentals, we discussed the behavior of Eastern consumers who react quickly to sharp price drops, while the reaction of consumers in some Western markets was delayed for several months. In the second half of the year, demand increased by 66.8 tonnes (7%) compared to the same period in 2012, and it is interesting to note that the US and UK together accounted for 14 tonnes of this increase. While the fourth quarter is traditionally the busiest quarter in these markets, due to Christmas celebrations during this period, these figures are significant given their size and direction - the first upward trend in demand in the fourth quarter in both markets since 2001.
Annual demand for jewelry in total US dollar terms has declined from a record high in 2012 ( Chart 6 ), which is not surprising in a significantly lower price environment. However, the magnitude of this decrease is only about 2%, which clearly demonstrates the strength of consumer demand in physical terms. This conclusion is confirmed when considering demand in individual countries, where a number of markets generated higher, and in some cases record, annual figures. New records were set in India (1,620 billion rupees), China (187 billion yuan) and Turkey (6.3 billion liras), while Japan recorded its highest figures since 2008 at 77. 6 billion yen. A long-term perspective shows that gold jewelry's share of global wealth has risen steadily since 2003 (with the exception of 2009, during the worst of the financial crises). In 2013, the share of gold jewelry was almost 0.14% of global GDP, while in the previous 10 years it was less than 0.08% ( Chart 5 ). It is important to note that the share of jewelry in global GDP in 2013 was 1/5 higher than in 1997, which was the peak of demand for gold jewelry in volume terms (3,293.9 tons).
A notable change in 2013, which we have already discussed in previous editions of the report, was the increasing preference for jewelry of a higher standard. This trend accelerated throughout the year, benefiting from this quasi-investment element for jewelry purchases, especially as the surge in demand in Q2 and Q3 resulted in a shortage of retail investment products. In the US, where the high end has always been relatively stable, the trend has become more pronounced at the lower end of the market, with mass retail brands moving away from ultra-low karat pieces to increase inventory of 14k jewelry. Demand for jewelry in eastern markets in the fourth quarter, moderated most likely by the scale of purchases in previous quarters, “cannibalized” the share of future demand. In addition, suggestions that prices had stabilized eased pressure on consumers, who no longer felt the need to shop urgently to take advantage of lower prices.
Jewelry demand in India in Q4 was little changed from the last quarter of 2012, where supply disruptions accounted for a slight decline . Local premiums rose sharply in the fourth quarter to a high of nearly $200 an ounce before falling back to previous levels in the final weeks of the year. The effect of lower prices clearly outweighed higher markups as Diwali purchases were healthy, setting up a strong performance in Q4. However, demand was significantly weaker in the second half of the year than in the exceptional first half of the year, creating a fairly good year on year for the sector as a whole.
The stabilization of jewelry demand in China in the fourth quarter was a likely consequence of previous record quarters . The slowdown was reflected in domestic market premiums, which briefly fell to discounts in mid-October as demand waned before rebounding again in November and December ahead of Chinese New Year.
The Chinese pattern of demand development was repeated in other Asian and Middle Eastern markets: robust demand in previous quarters, combined with neutralizing price expectations, led to a lull in October before a new surge in December . Although a similar pattern was observed in Turkey, the demand factors in that market were slightly different. A strike at the mint between July and September led to a shortage of coins in the market, making jewelry demand look better against this backdrop. The result was an improvement in the third quarter's already strong performance this season. However, the fourth quarter saw the opposite effect as coinage resumed after the strike and consumer demand for gold coins was met, to some extent, at the expense of jewelry.
Japan was an exception to the regional trend, where demand for jewelry increased in the second half of the year . This was partly due to a more robust economic environment, with a natural increase in consumer sentiment, and partly due to the upcoming increase in the domestic sales tax (from 5 to 8%), which will come into effect in April this year. The prospect of a tax hike has pushed consumers to buy ahead where possible to avoid paying the higher rate.
As discussed, US and UK consumer demand increased in the final months of the year, signaling the start of a trend for the first annual increase in demand in 12 years . However, Italy was not affected by this increase; Demand here continued its long-term downward trend as consumer sentiment and disposable income were hit by an uncertain economic and political environment. In general, we can say that the rate of decline has noticeably slowed down; for the first time since 2006, the decline in demand for jewelry did not exceed 10%.
Growth in annual demand for jewelry in Russia for the fourth year in a row led to the market reaching its highest level in 5 years, which was driven by the continued development of the middle class . As in the US and UK, the main growth here occurred in the second half of the year. However, the reason for the slowdown in growth rates was the slowdown in the Russian economy, as well as the depreciation of the ruble, which limited the impact of the decline in the international price of gold.
Investments
The main feature of the gold investment market in 2013 was the contrast between ETFs, which were the source of supply from the significant selling of institutional positions (-880.8 tons), and demand for bars and coins, which rose to the highest levels ever (1 654.1 t). During the fourth quarter, development followed a similar pattern, although after exceptional growth in the first three quarters, demand for small bars decreased. Despite the surge in bullion and coin sales, annual investment demand fell 50% in 2013.
US economic and monetary policy continued to be on the minds of professional investors, resulting in a further outflow of 180.3 tons of gold from ETFs during the last quarter. However, these outflows are expected to decline as the market has pared down its holdings to a strategic core following the liquidation of most tactical positions.
Adding the OTC investment and stock flow component to the overall investment income picture, it can be seen that total investment demand was 1,368.6 tons, down 10% from 2012. The amount of off-exchange investments in the second half of 2013 reached a previously unprecedented level of 580.8 tons. This fact requires explanation. As we mentioned, the movement of gold from west to east continued in the fourth quarter, although at a slower pace than previously. Most of these flows were intended to build and replenish stocks throughout the supply chain in the Asian region due to depletion that occurred in previous quarters. Caught off guard by the shortage, banks, manufacturers, wholesalers and retailers began replenishing stocks to avoid a repeat of the situation. The explanation for this activity and the impact of the growing trade and industrial sector (by some estimates China's output grew by 20%) discussed in the Fundamentals also applies to other Asian markets further increasing these replenishment flows.
OTC investment and stock flows also include demand for gold deposit accounts, which has increased in countries such as Turkey and China in particular. An additional element of this segment that contributed to the performance is gold, used to back financial transactions, for example in China, where a number of new instruments have been introduced (eg interbank swaps and ETFs).
The extreme growth in gold holdings is also an indicator of over-the-counter investment and stock flows. The increase in gold storage, which included the creation of large new storage facilities, is partly a reflection of growing demand for gold, some of which is not consumer demand but rather the supply chain replenishment mentioned above. Therefore, these non-trade demand bullion flows are included in the OTC investment figures.
Finally, this category also includes any flows to the official sector that are not publicly available and may exceed the norms for unannounced central bank purchases.
The nature of these flows makes it impossible to determine the exact size of the contribution made by each category to overall OTC investment performance. However, we can say with some confidence that they form a significant part of them. It's possible that this will impact the future valuation of the OTC investment category, as happened previously with Q1-Q3 performance, where much of it was pushed into bullion and coin demand as inventory changes and exceptional supply chain volumes worked to their advantage in the system.
Turning to the consumer side of the market, we see a continued crossover between demand for small bars and coins and demand for fine jewelry, given the latter's role as an investment product. This has been especially noticeable in markets such as China, India and the Middle East, where fine jewelry is the standard.
Chinese retail investment repeated its pattern of jewelry demand, with a brief lull in the fourth quarter as demand was overwhelmed by the previous buying frenzy . However, interest reignited in December ahead of the Chinese New Year, which was reflected in a slight increase in local price premiums.
The fact that demand for gold bars and coins in India in 2013 almost equaled the record of 2011 was entirely due to increased demand in the first half of the year , in anticipation of government measures to limit imports. High prices and limited supply have deterred consumers from expressing latent demand for these products. However, unofficial reports suggest coin inventories were being held in the third quarter as government policy was interpreted as a ban on coin sales. And after everything became clear, sales stopped being held back in October and November (during Diwali). High local markups allowed banks to sell coins at a discount.
Japan is particularly noteworthy in the context of retail investing, as net annual demand for these investment products turned positive for the first time since 2005 . After seven years of negative net investment demand (with a total outflow of 266.1 tons), this year Japanese investors generated positive net investment demand for three consecutive quarters. This is supported by a report from Tanaka Kikinzoku, Japan's largest bullion trader, which shows that gold bullion sales reached their highest level in five years at 37.3 tonnes. A key factor in this surge was an inflation hedge as Abenomics (the Prime Minister's policy) Minister Shinzo Abe) appeared to stimulate domestic inflation. The weakening yen also contributed to lower investment demand as local prices rebounded.
Is it better to buy or sell gold now?
The fall or rise in gold prices in the near future will depend primarily on market sentiment. The Federal Reserve and other central banks are expected to play an important role, as is the London Bullion Market Association (LBMA). Traders will be closely watching gold's relationship to the dollar index, known as DXY.
As stated earlier, trying to guess the exact price or time is an impossible feat. Ideally, precious metals are intended for long-term preservation of wealth, not short-term profit, as suggested by the IMF and the World Gold Council.
So deciding whether now is the right time to buy or sell the yellow precious metal depends on your personal circumstances: how much gold you already have in your portfolio and whether you need to free up some cash to buy are factors to consider, regardless Where are gold prices now?
Posted by Everett Millman April 8, 2021 | Translation: Gold Reserve
Should you invest in gold?
Unlike most world currencies, gold shows a permanent increase in price. Of course, everything depends on the chosen cut: if the trend is not so noticeable over a year, then over several years the positive dynamics of gold growth is obvious.
It is not for nothing that investing in gold is considered one of the most reliable investments, since such an investment is not afraid of any crises or inflation. Even a small amount can bring some income in a few years. If you invest serious money in gold, you can expect results quite quickly. Although, of course, there are risks with such an investment.
There are several investment options:
- investment coins;
- metal bill;
- ingots
There is no tax charged when purchasing gold coins, although the price per gram will be higher than the cost of the bullion. In addition, they can be kept at home, whereas bullion will have to be stored in a bank safe.
In recent years, metal accounts have become very popular. However, in this case there is one nuance that needs to be understood. This account does not imply the presence of real gold. Instead, numbers are used that change with the dynamics of the gold rate.
Investing in gold is not as simple as it might seem at first glance. After all, prices are subject to fluctuations. Therefore, short-term investments in such an asset are not recommended. There are great risks of losses. In addition, let's not forget that there is a certain difference in the purchase price and the selling price of metal. Therefore, in order to make money, there must be a fairly serious jump in prices.
VTB 24
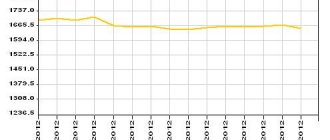
The gold rate at VTB24 Bank from July 1 to July 25, 2015 changed as follows:
Graph of gold exchange rate dynamics according to compulsory medical insurance at VTB24 (July 1-25, 2015)
The results of the dynamics of the gold exchange rate according to compulsory medical insurance at VTB24 Bank are as follows:
- the cost of purchasing one gram of unallocated gold by a bank decreased during the period under review by 50 rubles;
- the selling price also decreased by 50 rubles.
Alfa Bank
The situation with gold quotes under compulsory medical insurance at Alfa-Bank for the period from July 1 to July 25, 2015 is as follows:
We recommend reading: Where you can sell coins - an overview of sites for numismatists
A decrease in the cost of one gram of gold under compulsory medical insurance was also recorded in this banking institution. The losses were:
- minus 30.44 rubles in recalculation per gram of impersonal precious metal - relative to bank purchase indicators;
- identical indicators were recorded in relation to the dynamics of the cost of a bank’s sale of one gram of impersonal yellow precious metal.
Gazprombank
Another banking institution operating on the territory of the Russian Federation, whose gold quotes under compulsory medical insurance we would like to consider, is Gazprombank.
Indicators of dynamic changes in the cost of purchase and sale by a bank of impersonal yellow precious metal are reflected in the table:
It is important! Due to dynamic changes, the cost of purchasing one gram of unallocated gold by the bank decreased by 66.01 rubles, and the cost of selling – by 22.47 rubles.