Where to buy
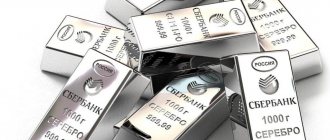
Bank measured silver bars are made from finished metal with a purity degree of 99.99%. Thus, these bars have a purity of 999.9. According to GOST requirements, they are trapezoidal in shape, weighing 28–32 kg. Scope of application: technical purposes and interbank settlements.
“The steadily increasing purchases of gold bullion by central banks suggest that another bull market – the silver bullion market – is likely on the horizon.”
Anderson, analyst
Banks also offer the precious metal in the form of bars to individuals as a long-term investment. But in this case we are talking about measured products weighing from 50, 100, 250, 500 and 1000 g.
The cost of a silver bar directly depends on its mass. For those who intend to invest in them, it should be understood that this investment is not for a short period.
If you want to quickly sell a product, you risk financial losses instead of income. The difference between the purchase price and the acquisition price may be insignificant, or even lower. Moreover, upon sale you will have to pay tax.
Transactions with precious metals in bullion are carried out in banks. For these purposes, a financial organization acquires a license from the Central Bank, specially equips a storage facility and recruits trained specialists.
“Silver is not as resistant to corrosion and has a significantly higher storage cost.
Since the metal is more than 100 times cheaper than gold, the same amount of silver will require a hundred times more storage volume” Alexey Kiriyenko, managing partner of EXANTE
Sberbank: conditions and purchase process
It is this financial organization that is considered the leader in the white metal market. But the transaction can be completed in offices of only 25 Russian cities.
Measured bars of 50–1000 g are subject to sale. A citizen only needs to present an identification document and have the required amount.
With a bar of bank silver, he receives a certificate and cash documents confirming the fact of the transaction.
Reference! When selling back, you will have to pay personal income tax if the bullion was owned for less than 3 years.
It is better to store the purchase in a bank safe deposit box. When selling, you will have to provide a safe rental agreement, a passport and a certificate for the precious metal. You can sell bullion that was stored at home. But then the bank will check the product being sold especially carefully. The same applies to silver purchased from another financial institution. If the condition of the bar is unsatisfactory or the certificate is unreadable, the cost may be reduced.
Table 1. Purchase/sale prices of measured silver bars in Sberbank as of 14:06 03/23/2020
| Nominal value, g | Purchase of an ingot of satisfactory/excellent quality, rub. | Sale of bullion in standard/high quality packaging, incl. VAT, rub. |
| 50 | 1 551/1 581 | 2 506/2 830 |
| 100 | 3 101/3 171 | 4 892/- |
| 250 | 7 753/7 903 | 11 451/11 979 |
| 500 | 15 505/15 755 | 22 242/22 974 |
| 1000 | 31 010/31 510 | 44 004/- |
Source: Sberbank website
Reference! The metal exchange rate can even change several times a day. Sberbank offers to track quotes on the website or in the client’s personal account.
Other banks
Not all Russian financial institutions work with special investment silver for the population.
Table 2. Sales prices, according to information from banks’ websites, rubles.
| Nominal value, g | ||
| 500 | 1000 | |
| Rosselkhozbank | 23 420 | 46 260 |
| Gazprombank | 23 140 | 46 280 |
| SPM Bank | 28 865 | 56 050 |
Sources: RSHB, Gazprombank, smpbank.ru
They are also offered for sale by: Promsvyazbank, FC Otkritie - prices are formed daily based on changing quotes. Many organizations, both those that trade in bullion and those that do not have storage conditions, offer clients to open impersonal metal accounts.
How the price changed
According to the Bank of Russia, a gram of silver in the Russian Federation at the beginning of 2021 cost 35.48 rubles. By March 24, 2021, it had fallen slightly in price - already 32.84 rubles.
Chart 1. Change in the accounting price of silver in Russia, rub. per gram in early January. Source: Central Bank
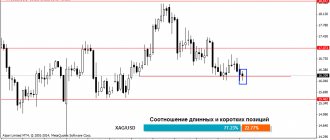
According to information published on the INVESTFUNDS website, the cost of an ounce of this precious metal on the London (interbank) bullion market has decreased over the past 10 years.
Reference! 1 ounce of silver is equal to 31.1034768 grams.
As of March 23, 2010, it was $16.78. After 10 years, March 23, 2020 – $12.51. But during this period, a historic price jump was recorded to $48.70. This happened at the end of April 2011. The cheapest silver was traded on March 19, 2020 – for $12.01.
Cost per ounce, $ per unit. Source: INVESTFUNDS with reference to the London (interbank) bullion market
“If the situation with coronavirus is reversed in the first half of 2021, the price of silver may recover to $15-16.5 per troy ounce”
Alexey Kiriyenko, managing partner of EXANTE
Compare how gold prices have changed.
Silver.
Many are still expecting a vertical surge in the price of silver. We are told that this is inevitable and that solid fundamentals support it. These fundamentals include supply shortages, a return to the 16:1 gold/silver ratio, rising monetary demand for silver, etc.
However, examining these fundamentals paints a different picture. This picture is inconsistent with forecasts for higher silver prices.
SUPPLY AND DEMAND OF SILVER, RELATIONS
The shortage of supply (consumption exceeding production) has been talked about for decades. In the 1960s and 1970s, this was the main fundamental justification for higher silver price predictions.
In the 20th century, the industrial use of silver grew so much that consumption of the metal at some point began to exceed new production. This is how the gap between consumption and production that is referred to appeared. Then the government began actively selling to keep the price low. The specific goal was to keep the price from exceeding $1.29 per ounce. At this level, the amount of silver in a silver dollar (not a silver eagle) is worth exactly $1.00.
The huge increase in the price of silver in the 1970s was largely due to the long years of price suppression that preceded it . However, these years of price suppression were preceded by decades of price support.
Neither price suppression nor price support are significant issues today. The underlying supply-demand imbalance was corrected in the 1970s. If this were not the case, the price of silver could be much higher than it actually is.
Expectations for a return to the 16:1 gold-to-silver ratio will not materialize. The gold/silver ratio of 150 years ago was largely the result of political influence and appeasement. There are no fundamental reasons justifying any relationship between gold and silver.
Gold to Silver Ratio – 100 Year Historical Chart
As you can see in the chart above, the gold/silver ratio continues to rise in favor of gold.
SILVER FUNDAMENTALS
Silver is an industrial commodity resource. Its primary demand is driven by—and its price determined by—industrial consumption. Any role for silver as a monetary hedge is secondary. This is true even in light of the significant increase in the amount of silver used to mint bullion and coins, particularly silver eagles.
Fundamentals simply do not support bullish expectations for silver. There are also indicators that make silver vulnerable to a large price decline.
Deflation is a more likely short-term possibility than hyperinflation. True deflation causes the general price level of goods and services to decline.
The price of silver, as an industrial commodity resource, will reflect the full severity of the consequences of deflation. Silver's low during the Great Depression was $0.28 an ounce in 1932. It coincided with the stock market low.
Something similar happened in March-April 2021 when silver and equities fell 35%.
It is also possible that relative prosperity and disinflation may continue for several more years, which will not stop the further decline in the price of silver.
HISTORICAL PERSPECTIVE
After peaking at $48.00 an ounce in 1980, the price of silver fell 92% over the next 13 years. It reached a low of $3.57 an ounce (February 1993) during the boom of the 1990s.
Silver's last peak near $50.00 an ounce was 10 years ago. At the current price of about $25.00, silver is half the price. You can see this in the graph below...
Silver Price – 10 Year Historical Chart
With that in mind, does it matter that silver has doubled in the last year? All this growth is only a partial recovery from losses.
From a historical perspective, most of the reasons given for the significant rise in the price of silver become less credible when you look at the facts.
CONCLUSION
Silver is ineffective as a monetary hedge because it is not a store of value. Silver should now be worth around $100.00 an ounce to reflect the US dollar's loss of purchasing power over the last century, much like gold's current price of $1800 an ounce.
It is far from this figure, and there is no historical precedent to expect the gap between gold and silver to narrow in favor of silver. As the dollar continues to lose purchasing power, the gap between the price of gold and silver will continue to widen in favor of gold.
Moreover, on the few occasions when the price of silver rose significantly, it quickly lost most of those gains.
In other words, the price of silver is likely to decline. And it can be quite significant.
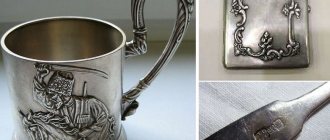
During the Soviet period
GOST 48-78-83, published on July 1, 1983, set out uniform requirements that guarantee the competitiveness of products on the world market. Silver bars were then produced in two grades: SrA-1 and SrA-2. With the introduction of GOST 28595-90, approved. By Decree of the USSR State Standard dated June 27, 1990 No. 1919, a new brand appeared - SrA-3. Moreover, the mass fraction of silver was:
- SrA-1 – 99.99;
- SrA-2 – 99.98;
- SrA-3 – 99.90.
The production of bars was organized exclusively for the manufacture of alloys, industrial products, etc. Money made from white precious metal was much more widespread. It is from them that one can judge how much the white metal was valued in the USSR.
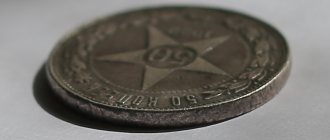
Change coins in denominations of 10, 15, 20 from silver of 500 standard, 50 kopecks and 1 ruble - 900 in the Land of the Soviets were put into circulation in 1924. Each fifty-kopeck piece contained 10 g, and in the ruble - 20 g of precious metal In low-grade silver coins:
- 20 kopecks – 3.6 g;
- 15 kopecks – 2.7 g;
- 10 kopecks – 1.8 g.
Before World War II, the price per ounce dropped to $0.25. By 1960 it had risen to $1 and continued to rise.
In the 1970s it traded for no more than $5. Since 1978, the price of the precious metal began to soar. By the fall of 1979, it exceeded the $10 mark, and in January 1980, the market recorded a record of $48.90. A couple of years later, the metal was again below $10 per ounce (goldtraders).
“Look at the price movements of silver in the 1970s and early 2000s and you can see just how dramatic the ups and downs can be.”
Anderson, analyst
Silver rate in 2021
— The London Bullion Market Association silver price averaged $15.71 per ounce in 2021, down 7.8% year over year. Prices have fluctuated in the range of $3.55 per ounce over the past year, reaching a high of $17.52 per ounce and a low of $13.97 per ounce.
- In absolute terms, the London Association silver price fell 8.3% in 2021 after rising 3.8% in 2021. Many factors influenced the price of silver last year, most notably the trade negotiations between China and the United States, which led to a stronger dollar, as well as lower prices for metals, including silver.
2017 was a good year for precious metals prices, as the dollar index fell 10% that year. An increase in prices for silver and other metals was also observed in the first quarter of 2021. Interestingly, after reaching new highs, US stock markets suffered from major consolidation in the first week of February, but gold failed to emerge as a safe haven asset at the same time. Investors also got rid of it because the market needed liquidity. Silver, given its industrial demand, reacted in a similar way to the correction in stock markets, falling below $17 per ounce (it only managed to reach this mark again in April). During the second week of February, financial markets began to stabilize. In February, newly appointed US Federal Reserve Chairman Jerome Powell gave his first speech in his new role, and the market took this speech as an indication of aggressive monetary policy. The market began to expect that the Fed would raise interest rates at its next meeting on March 18, which led to a further decline in silver prices.
In addition, political tensions between Russia and the United States escalated in March, strengthening the position of both gold and silver. As for the silver price, although it managed to remain above $16 per ounce by the end of the first quarter, the annualized return (at the same quarter level) for the first quarter was -3.5%.
Thereafter, from April to June, the price of silver moved sideways, mostly in the $16-$17 range with a slight downward bias, as the second quarter is traditionally a bad season for precious metals. Concerns about the fixed income market plagued investors in April, but the 10-year yield rose towards 3%.
This led to a strengthening of the US dollar, as well as lower prices for gold and silver. By the end of June, instability on a global scale increased due to the high likelihood of a trade war between the US and China. Contrary to expectations, investors viewed the US dollar as the most important safe haven asset, while precious metals including gold and silver fell in price. At the end of June, for the first time since 2021, the price of silver fell below $16 an ounce, having lost 1.5% in the second quarter.
In the third quarter, Brexit negotiations between the UK government and the European Union failed to generate interest in buying defensive assets. Meanwhile, the US dollar index reacted positively to hawkish comments from Fed Chairman Jerome Powell, matching market expectations about the likelihood of an interest rate hike at its next meeting. As markets continued to watch news on the trade front, developing countries suffered from capital outflows due to the expected tightening of liquidity in the US, leading to declines in both currencies and emerging market stocks. However, US stocks began to rise again as economic data for the country showed positive data, which, along with a strengthening US dollar, led to the price of the white metal falling below $15 per ounce in August, ultimately losing 10.8% of its value. in the third quarter.
In the last quarter, silver finally recovered, although it wasn't until December. The white metal continued to fall in price early in the fourth quarter, falling below $14 an ounce in mid-November. However, as concerns about a slowdown in US economic growth intensified, the market began to think that the Fed might pause raising interest rates. When the Fed chairman raised interest rates another 25 basis points at its December meeting, investors responded by selling off their holdings in the stock market. The US dollar index also fell on expectations that interest rate hikes would be paused, leading to a sharp rebound in precious metals. Silver rose 6% in the final quarter of the year, but for the year its price fell 8.1% overall. Silver price volatility decreased in 2021 from 19% to 14% in the previous year. This figure has decreased over two years, and last year it was the lowest in the last decade. It is interesting to note that year-on-year silver price volatility reached 61% in 2011.
Silver premium in China
If you look at the price of a contract for trading silver on the Shanghai Gold Exchange, the price of this precious metal in China in 2018 lost 3.7% more in domestic currency compared to an 8.3% drop in the international exchange rate set in London. This was due to the depreciation of the yuan in 2021, which fell 5.4% against the US dollar. All silver prices on domestic futures exchanges in China are quoted including 16% VAT. The average annual silver premium rose to $1.3 per ounce in 2021, up from $1.04 per ounce the previous year. Silver inventories on the Shanghai Futures Exchange fell from 43.1 million ounces (1,342 tons) at the end of 2021 to 35.8 million ounces (1,114 tons) in 2021. Inventories on the Shanghai Gold Exchange rose from 40.5 million ounces (1,260 tons) to 68.5 million ounces (2,131 tons) over the same period. As a result, the combined volume of physical reserves on these two exchanges increased from 83.7 million ounces (2,602 tons) to 104.3 million ounces (3,245 tons) at the end of last year, an increase of 25% compared to the same period previous year. The main factor behind the growth of physical inventories on the Shanghai Gold Exchange was the accumulation of physical silver by domestic banks. Bankers found the price of silver attractive, and they also benefited from the deferred payment option available only on the Shanghai Gold Exchange and received from traders with smaller positions. The deferment fee compares favorably with the higher trading fees on the Shanghai Gold Exchange.
Silver in other currencies
The yen price of silver fell 11% last year as the Japanese currency rose less than 3% against the US dollar. Meanwhile, silver prices in euros and British pounds fell 5% and 3% respectively over the year. The silver rate in India was 0.7% lower at the end of the year relative to the international fixing.
Gold-silver ratio
After reaching its lowest level in 2010, the gold-silver ratio has steadily increased. This indicator decreased slightly in mid-2021, reaching 70.9 points, but then resumed its upward trend in mid-2021. The coefficient can grow in a crisis, although the rate of this growth depends on the nature of such a crisis. If all signs point to increased market volatility, then investors usually prefer gold to silver.
During the 2008 global financial crisis, the ratio rose above 80; in the long term, gold is always more expensive than silver, or silver is cheaper than gold by an average of almost 65 points. High ratio in the early 1990s. was a consequence of the Gulf War. It can be argued that in anticipation of a crisis the coefficient reaches above 80 points.
By the end of 2021, the ratio stood at 77 points, and this high level may have signaled another major crisis. In February 2021, the ratio rose again to 80 points, and was in the range of 74-83 until September, when a crisis of liquidity and investor confidence erupted in emerging markets. The ratio even peaked at 86 points in the first week of December. However, soon after both the US stock markets and the dollar fell sharply, silver outperformed gold prices (despite expectations of a weakening US economy) and ended the year at 83.6.
Silver and other commodity prices
Analysis of correlation coefficients provides information about the most significant factors influencing prices.
It should be noted, however, that the existence of either a positive or inverse correlation between two assets is not always guaranteed from time to time, so past trends are not necessarily relevant for predicting the future.
Traditionally, silver is more highly correlated with gold than with other assets. Despite this, however, the gold price ratio has fallen in 2021. The silver-to-gold ratio was the strongest in the first quarter of the year, although it also recorded a relatively high correlation with the S&P 500 Index at a time when both the white metal and the index declined in the first quarter.
In the second quarter, the silver-to-gold ratio fell to its lowest point in a year, with the market considering it more of a base metal than a precious metal, as evidenced by its increased correlation with copper.
In the third quarter, silver's correlation to gold increased as both metals were weakened by concerns about a global trade war, but panic in emerging markets also helped mitigate some of the losses in the gold price, and the gold-silver ratio rose markedly again in September. Silver's correlation with oil turned negative during the quarter as the price of oil continued to rise after OPEC rejected President Trump's request to increase production.
Silver's correlation with other commodities increased in the last quarter, mainly due to sharp declines in both the US stock market and the dollar index, which led to strong gains in many commodity prices.
Last year, one of the main topics that constantly attracted attention in the financial market was the trade war between the US and China. Concerns over a trade war supported the US currency, causing silver to have a clear negative correlation with the US dollar throughout the year.
Silver's correlation with gold remained strong in the first two months of 2021, while the correlation with oil prices and the US Dollar Index remained negative.
Country overview
A large number of mints and refiners around the world produce silver bars in different shapes, sizes and designs.
goodfon.ru/ Ivan-chirko
When determining the price, they are guided by current quotes per ounce.
Table 3. Cost of a 1 ounce bar at 16:40 on March 23
| Countries | In national currency | Designation | To US$ |
| USA | 14,48 | USD | 14,48 |
| Europe | 12,99 | EUR | 13,93 |
| China | 102,76 | CNY | 14,44 |
| For reference: Russian Federation | 1 021,44 | RUR | 13,09 |
Source: silverprice, exchange rates as of March 23 – kurs-dollar with reference to Forex
- Great Britain.
The Royal Mint produces three types of silver bars that are the perfect addition to any portfolio or collection: 100g, 500g and 1000g. They are made from 999 fine metal. Each is stamped with The Royal Mint logo, as well as weight, year of manufacture and serial number.
- Canada.
The Royal Canadian Mint (RCM) is respected throughout the world. It produces some of the finest silver bullion. RCM produces various types of them. The most popular is 10 ounces, with mid-range sizes ranging from 100 to 1000, each with the RCM logo and the serial number, weight and purity.
- Australia.
The Perth Mint is the country's largest precious metals production facility. The quality of Perth Mint products is of the highest standards.
The 1 oz 999.9 Fine Silver Kangaroo Bar is an elegant bar with the Perth Mint logo and weight and purity notes.
Photo: Kangaroo ingot
The silver bar will remain a symbol of reliability for a long time, and its investment potential will be high. According to GOLDPRICE, their prices today are among the best among precious metals.
Author: Demidova Marina. April 7, 2021.